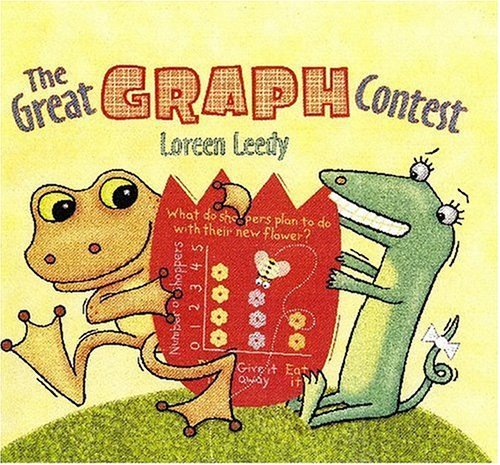
Two comical creatures go crazy with graphs in an imaginative look at organizing information. Kids can learn about bar graphs, pie charts, Venn diagrams, and more.
Loreen Leedy is the author and illustrator of over 40 picture books with math, science, language arts, and other curriculum content. Her books showcase information in a kid-friendly format, often with characters and entertaining stories.
Honors and awards for her books include: ALA Notable Book, Science Books and Films finalist, Reading Rainbow feature book, Chicago Library Best of the Best, many Scholastic Book Fair selections, Florida Book Award, Parent's Choice Award, many Junior Library Guild selections, and Outstanding Science Trade Book by the National Science Teachers Association.
Loreen has spoken at hundreds of schools and many conferences such as the International Reading Association, the American Library Association, the Mazza Summer Conference, and the UVU Engaged Reading Forum.
She lives in central Florida with her husband Andy, who is a scientist and a cat named Knickers who has an easily triggered purrometer. They love to travel, read, and watch movies.
Highly recommend for teaching/introducing 1st grade math, enVision curriculum Topic 6!!! Graphs included in this book are pie charts (called "circle graphs" in the book), pictographs ("picture graphs"), bar graphs, quantity graphs, and Venn Diagrams! There are many different representations of the different graphs and tons of opportunities to stop and talk about the different types of graphs. Students can recognize different characteristics about the math in each graph. Awesome book for teaching math in a read aloud book to begin this math topic. Ask students questions about what they notice in the graphs; students can also make predictions about which character is going to win the graph contest! Also, science can be connected with the learning in this book too.
4 kind of graph: _ Quantity graph _ Circle graph --> drawing thing into that too, not only change color. _ Venn diagram --> change the set A, b, c into drawing real things. _ Bar graph --> we can change rectangle bar to flower or any icon bar. Great to look! Creative work! Thank Loreen Leedy.
The mix of photos and illustrations and art styles is phenomenal and fun! There are so many great details to look out for. I can't believe I almost missed one on the butterfly page; my daughter pointed it out to me. Hint: It's tiny and related to what they're doing. A nice bonus to this book is that it's educational, and I think without even feeling like it!
This is a great idea for introducing kids to graphs. There are a number of different types of graphs shown at varying levels of complexity. I found the artwork unappealing though.
This is a cute introduction to pie charts, bar charts, unit charts, and Venn diagrams! It includes 11 inspirational graphs that elementary students could easily reproduce.
Personal Reaction: I think this is a very fun and interesting book with great illustrations. It makes math look fun and interesting. And when your not very fond of math, making it look interesting is hard!! I also love the word bubbles for each character and the collage like illustrations. Very cool!
Purpose: Read aloud for students K-3 grades -entertainment/enjoyment: the book has some really great illustrations that use a lot of different media that will engage the students into the story and the idea of graphs. -the personification of the animals will make it easier for them to become engaged because it is a different point of view with entertaining "likes and dislikes". -imaginative: the story obviously has a lot of imagination and thought put into it to make it more engaging for students. The students could come up with their own graphing story to teach other students about the different types of graphs -the items they are graphing are fun things that the students may be interested in like flowers, rocks, swimsuits, cookies, and animals. -a different way of looking and learning about the types of graphs
Curriculum: Read aloud for students K-3 grades -introducing students to graphing (graphing, pie charts, Venn diagrams) -great for a lesson on grouping items into categories -introduction to research, graphing, and recording results -the process of gathering data and creating graphs- "1) think of a question to ask 2)collect data and write it down 3) use real objects and/or art supplies to create a graph, 4) put a title and labels on your graph so that people will know that it is about." -a fun activity would be for the students to go around the classroom and ask a question, collect data, and create different kinds of graphs to show their findings. Or have the class work in small groups with different objects to make a certain type of graph, then move to a different station to create a new type of graph.
personal reaction- I really enjoyed this book because growing up, in school i wasn't the biggest fan of math. When it was time to start the math lesson, i would go to the bathroom just to avoid having to sit through the lesson. But this book showed me that learning math when i was younger could have been more beneficial if i was read a book like this. I also really enjoyed the illustrations throughout the book. The illustrations take the form of a collage, drawing my eyes on the pages to examine the entire page.
purpose/use in the classroom- This story would be most beneficial to students in the second grade.In the second grade, student start to learn more about graphs, venn diagrams, and charts. This book would be a great story to read out loud when introducing these topics in math in the classroom. This book could also be used when teaching students on how to collect data for the graphs. This could be a long and difficult process for students, so starting out with this fun and colorful book will help students see an example of graphs and collecting data for the graphs. Overall this is a great read aloud for students when starting the frustrating topic of math,specifically when dealing with graphs and charts.
-While reading "The Great Graph Contest," I enjoyed seeing a different type of layout in a book. There are multiple animals and word bubbles to show their conversations about graphs. One graph is done by using cookies by a lizard. He wonders which kind of cookie there are more of, so he stacks them up and discovers the answer that way by incorporating a graph.
Purpose:
-I would read this story out loud or having students read it in groups. The purpose of this book is for children's enjoyment and understanding of graphs. -Since the book focuses on graphs, it would be ideal to use this for a graphing unit in a math class. I would bring cookies just like the book and stack them to show the importance of graphing in every day life. -The conversation bubbles on each page could also be used to show the interaction between the animals. Students could practice writing using conversation bubbles so that it is both fun and productive.
I have a hard time with caption based storybooks. They are tough to read aloud and tough to read independently-for the age group it is targeting. Stronger readers with other exposure to captions would do well with this book as an independent read, but even I got a little lost on a couple of pages. However the goal of this book is to, in my mind, expose students to all types of graphs and have them learn about them in the process. It definitely does this and does this well--really loved all the graphs, the competition, and the brainstorming behind the graphs. Additionally the illustrations are great, with some being life-like. If I were introducing graphs, I would use this book as a support, but perhaps focus on just a few pages at a time--or if I had multiple copies, it would be great for a small group facilitation.
This book shows animals around a swamp having a graph contest. In it, they depict different components of their neighborhood. While reading, discuss the types of graph with the students: a direct comparison by grouping; a bar graph made of real cookies, a Venn diagram, a circle graph, a pictograph, and a survey with a bar graph. Challenge students to their own graph contest, working in small groups. Students must come up with a question related to their own real-world experience, explain how they will collect the data (e.g. observation, experiment, survey, etc.), collect the data, display it on a graph, and analyze the data (e.g. there are more students in 3rd grade than 4th grade). Give groups multiple class periods to complete the assignment.
Great book for practicing graphing in the classroom!! I would use this book in grades 1st through 3rd grade. The book shows animals around a swamp having a graphing contest while discussing different types of graphs. They review over direct comparison by regrouping, bar graph, and challenge you while reading to make your own graph to win the contest. I really like how it engages students to practice during the reading in a fun way! This would be a great mini lesson to practice graphing with a SWAMP CONTEST theme and students have to use objects they would find in swamp while working with partners. Students must come up with a question and design own bar graph.
Use this book to show students the different graphs that can be utilized to show data. The book shows how different cookies are stacked making a bar graph. Venn Diagrams in addition to others such as circle graphs and pictographs are also shown and well explained. I would use this book to review graphs and then allow students to graph items themselves using classroom manipulatives. Students could be paired up and work on graphs at their desk. After 5 minutes students could then rotate to another desk to work with another station.
This book is great for introducing 1st-3rd graders to various types of graphs. It has lots of great information, but it's not overwhelming. Instead, it is presented as a story in which two characters hold a contest to see who can make the best graphs. At the end of the book, the different types of graphs (quantity, circle, venn diagram, bar, pictograph) are discussed in more detail as well as instructions for children to make their own graphs. This would be a great read aloud that would encourage students to make unique graphs.
A fun book for first through third grade students to learn about different types of grass. In the book the animals in a swamp or holding a graph contest. Each animal uses a different type of graph. This book includes bar-graphs, pie graphs, venn diagrams, and more. After reading this book you could ask your students to have their own graph contest. You could give one set of information and ask each student to use a different type of graph to represent it.
In The Great Graph Contest, Gonk the Toad and Beezy the Lizard compare items found in their swamp and have a contest to see who can create the best graph. I would use this book as a mentor text to teach about different types of graphs. I would set up various stations around the classroom and throughout the unit allow students to visit each station with their small group to create each kind of graph; bar graph, pie graph, pictograph, venn diagram, etc, using a the materials provided.
Chester comes up with a contest to see who can make the best graph. He is looking for neatness, creativty, and accuracy. This book teaches students how to survey and collect information. also, it teaches students about the differen types of graphs. I recommend this book to teachers who are doing graphing.
This is a great book for introducing graphing to Children. This book introduces students to direct comparison by grouping; a bar graph made of real cookies, a Venn diagram, a circle graph, a pictograph, and a survey with a bar graph. I think it would be great for K or 1st grade.Or even higher grades depending on what you present with the book. Students are given activities through out the book.
This story provides children with a look at all the different ways they can record and graph information. It is the perfect story to begin a lesson on graphs. After reading the book, the teacher could show children how to create graphs by doing simple opinion graphs (ex. What is your favorite color?)and creating the graph as a class.
This is a very informative book that helps engage kids through the animals conversing with each other about graphs and polls! It is designed in a playful manner and the illustrations are inviting and colorful. I love that the entire book is arranged through thought bubbles, it creates a more personal relationship between the characters and reader.
Grades K-1. Nonfiction Picture Book. Characters observe and report their findings using different kinds of graphs. Students could create their own surveys. Rope could be used to make giant ven diagrams (Ex: boys, wearing blue, boys wearing blue.)
An awesome math book! Most of it was over my 4-year-old's head, but he loved it and we even did a little bar graph of our own to figure out which ingredient there is the most of in the oatmeal cookies we made (oatmeal).
I would pull this book to introduce graphs and the multiple ways to represent information. There are many different graphs represented in this story about two animals in a competition on who has the better graph.
This book is a pretty easy read that follows a group of animal friends as they compete to make the best graph. This would be good to introduce a math lesson about graphing or a science lesson about how to format and record data and observations. I would suggest this book for grades K-3.
I absolutely love this book! It is so great to teach students about all the different types of graphs. They give examples of how to use each graph and what each graph looks like. In the back it gives further information about each grapgh followed by a graph activity.
This book is great for talking about graphs. There are so many different types of graphs in this story which is great. Some friends decide to have a contest to see who can make the best graph. It ended up being a tie!