It's surprisingly tricky to design simple, "everyday" charts for reports and presentations. Even experienced data pros and major news media outlets often create charts that leave audiences bored, unconvinced, confused, or—worst of all—that accidentally misrepresent the underlying data. Why does this happen? Well, design decisions like choosing a chart type, choosing colors, and deciding what range a scale should span require a surprising amount of expertise to get right.
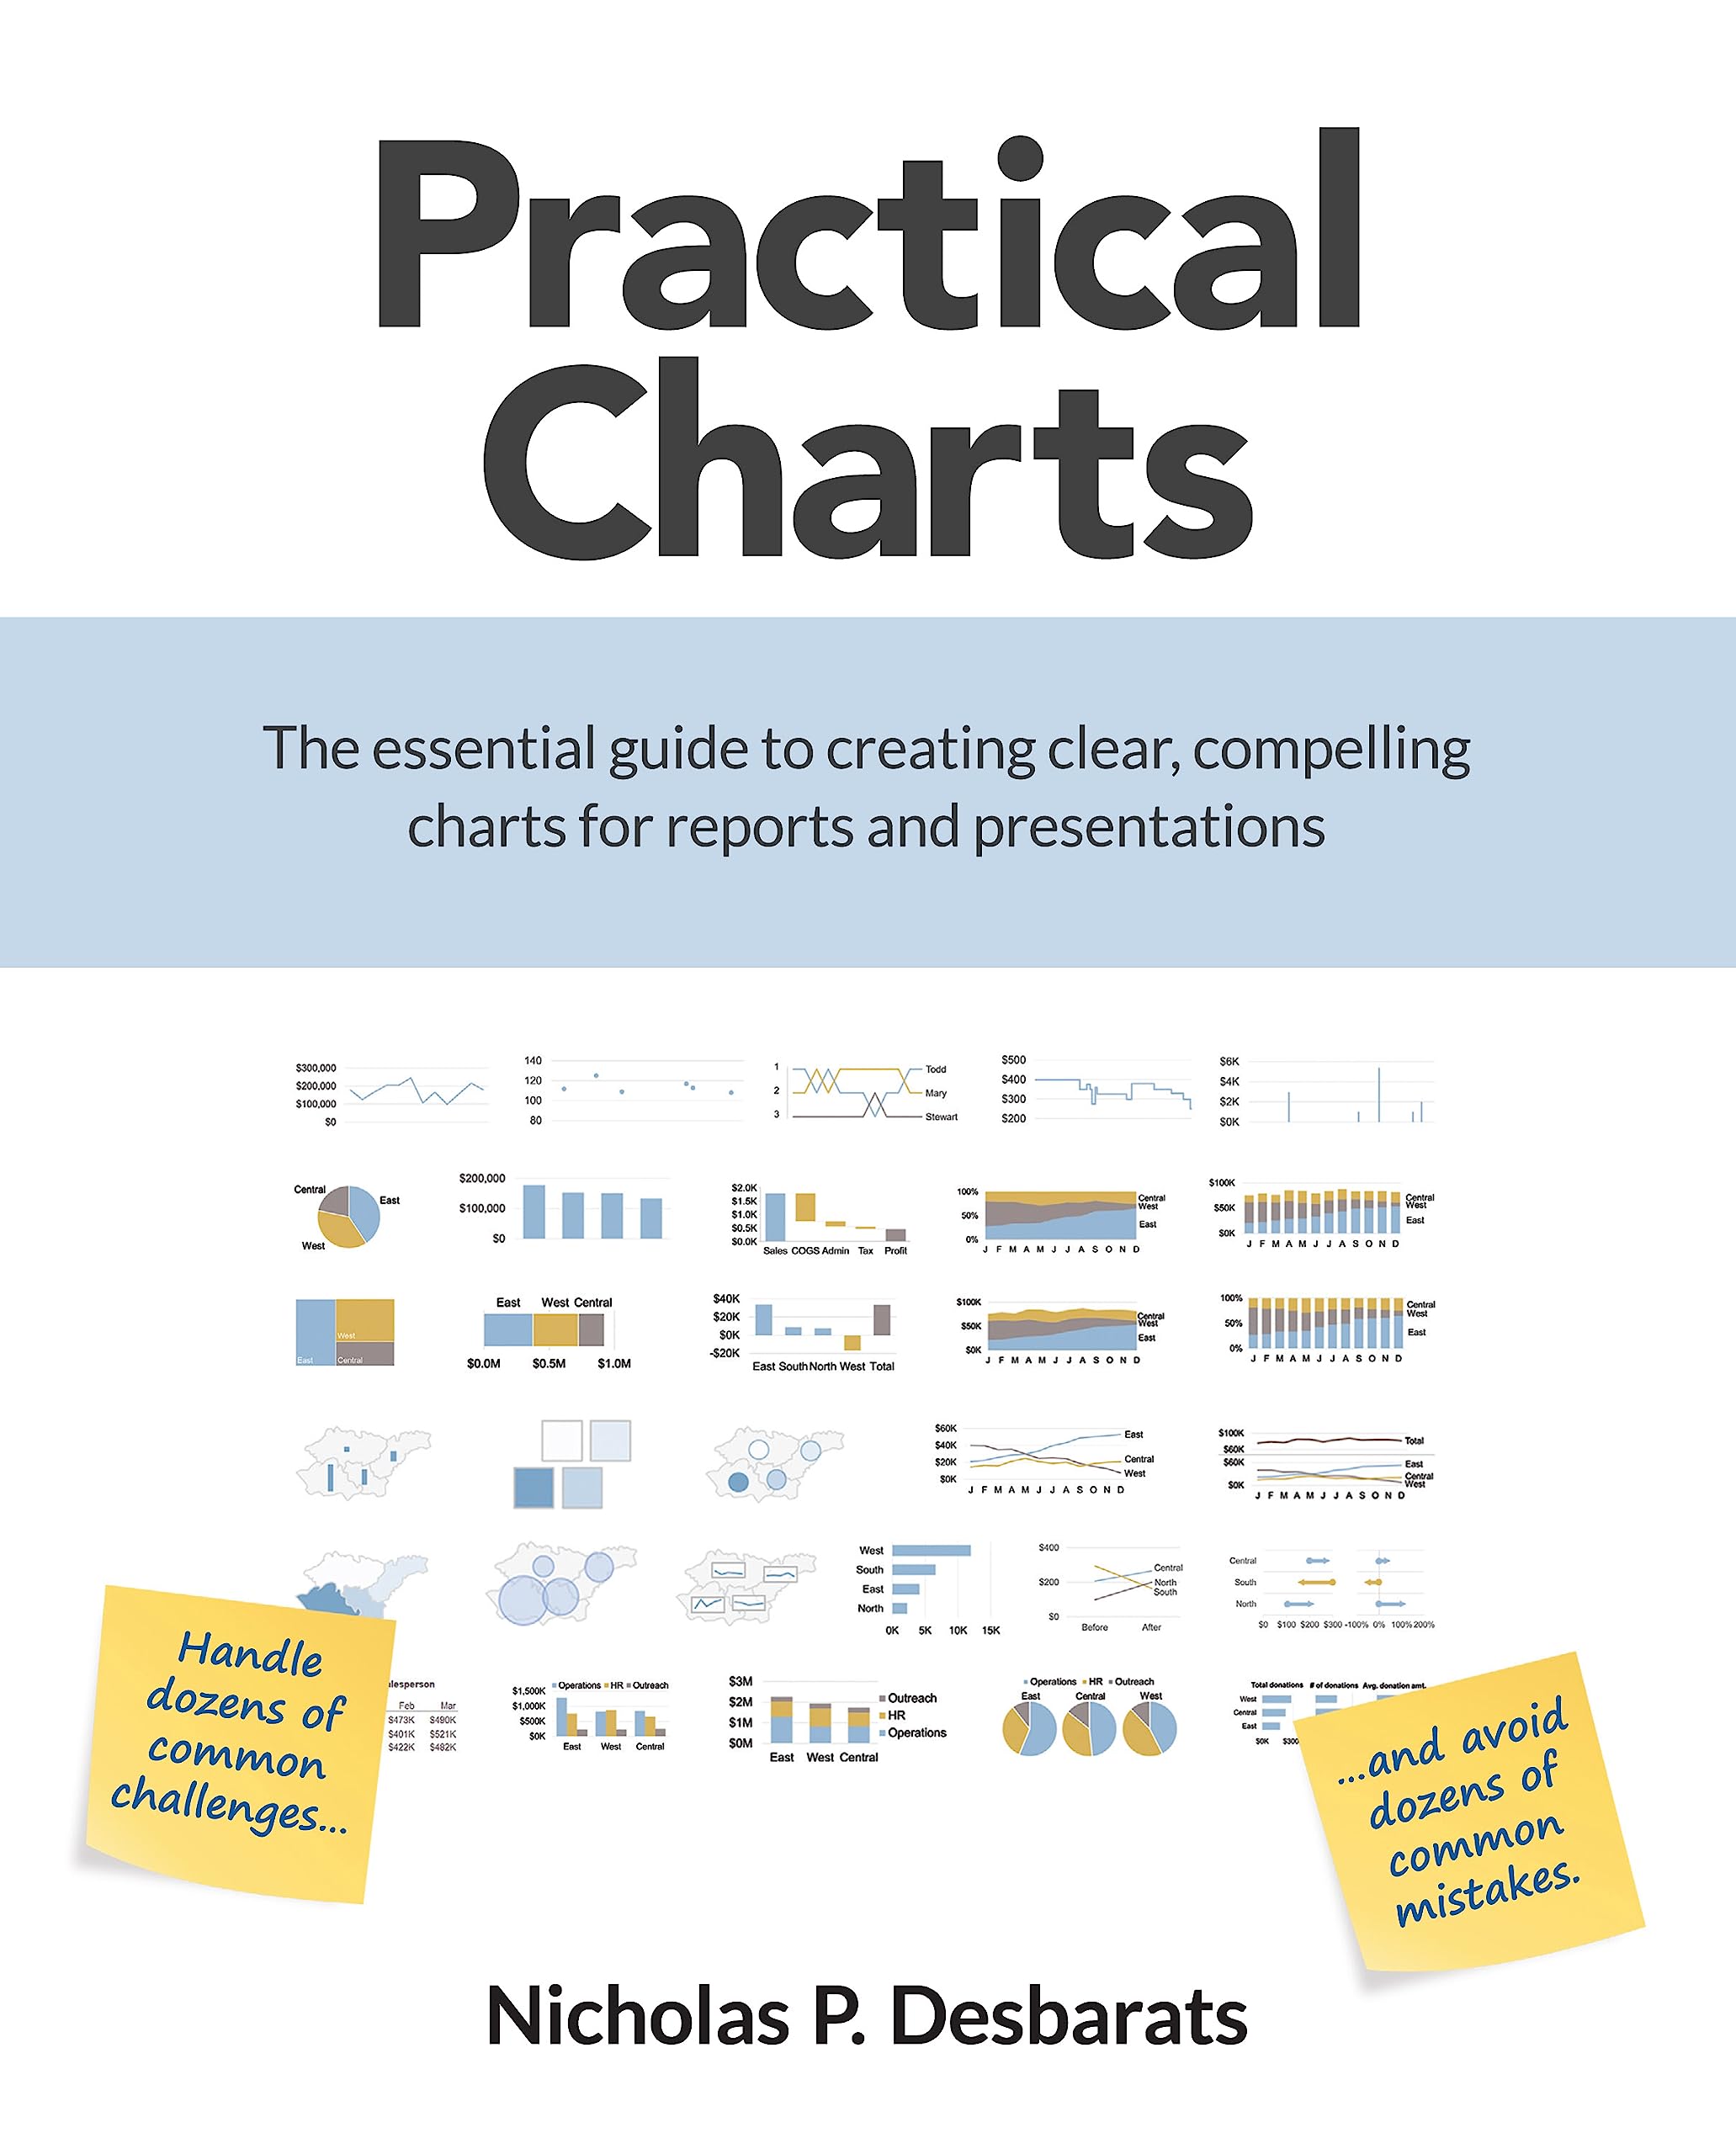
Practical Charts provides easy-to-follow, concrete guidelines that quickly enable chart makers of any experience level to design expert-level charts that are clear and compelling. Readers will learn how to tackle over 90% of the chart design challenges that arise in real-world situations and how to avoid over 90% of the common mistakes that chart creators make. Written in an entertaining, jargon-free style by globally recognized data visualization expert Nick Desbarats, Practical Charts condenses the courses that he's delivered for NASA, The United Nations, Blomberg, Visa, Yale University, and many others into an easy-to-read book that includes...
As an independent educator, Nick Desbarats has taught data visualization and information dashboard design to thousands of professionals in over a dozen countries at organizations such as NASA, Bloomberg, Visa, The United Nations, Yale University, Shopify, The Internal Revenue Service, The Central Bank of Tanzania, and many others.
Nick was the first and only educator to be authorized by Stephen Few to deliver his foundational data visualization and dashboard design workshops, which he taught from 2014 until launching his own workshops in 2019. He has held senior executive positions at several software companies and was a co-founder of BitFlash Inc., which raised over $20M in venture financing and was sold to OpenText Corporation. In 2012, Nick was granted a United States patent in the decision-support field.
Nick’s articles in Nightingale (the journal of the Data Visualization Society) are among that publication’s most widely read and shared, and he regularly delivers main-stage talks at conferences such as Tableau Conference, TDWI World Conference, Data Innovation Summit, and SAS Explorers. He has extensive knowledge of data visualization, information dashboard design, business intelligence, data analysis, cognition and cognitive biases, perception, memory and learning, software design and development, and product management.
For more information about Nick, and for new book and training workshop announcements, please visit www.practicalreporting.com.
As a dashboard developer, I've found this book on data visualization to be my absolute favorite. It's truly amazing and incredibly helpful. While I've gained valuable insights from renowned authors like Stephen Few, Cole Knaflic, Alberto Cairo, and others in the field, Practical Charts stands out for a couple of key reasons.
Desbarats addresses common, challenging issues that I frequently encounter, such as scale formatting, chart selection, and how to flag values. Unlike other authors who offer general recommendations for somewhat general situations, Desbarats takes it a step further by providing concrete advice that genuinely works. I'm particularly impressed by his ability to reason from first principles, leading to a reevaluation of common practices and errors in data visualization.
The clarity of the book is another standout feature. Despite dealing with complex issues, Desbarats goes to great lengths to ensure that the content is easy to understand. The examples are insightful, the advice is practical, and his prose is direct and simple. I appreciate his reluctance to use unnecessarily complex terms, such as avoiding the term "preattentive attributes."
Moreover, the book is comprehensive, addressing nearly all the problems one might face when working with charts. The decision trees for selecting visualizations have been extremely helpful, introducing me to charts I hadn't encountered before but now eagerly include in my dashboards. Desbarats has even supplemented the content with additional online blog posts, delving into specific topics for those who want to explore the nitty-gritty details.
I wholeheartedly recommend this book to anyone interested in data visualization; it has become my go-to reference.
“Practical Charts” by Nicholas Desbarats is an exceptional guide that brilliantly demystifies the world of data visualization. The author’s profound expertise shines through every chapter, making the book a comprehensive and accessible resource for beginners and experts alike.
Desbarats’ practical approach is the highlight of this book. He provides readers with invaluable insights and hands-on techniques for creating effective and visually appealing charts. The real-world examples are not only relevant but also stimulate readers to apply their learnings in their respective fields.
I loved the Key takeaway boxes in each step, where he emphasizes the most important/interesting topic to remember.
The concepts are explained with clarity, and the accompanying diagrams and charts are well-designed, further solidifying the reader’s understanding.
Whether this is your first approach to dataviz or you are already an expert, there's something for you to take away from this book.
In conclusion, “Practical Charts” is a must-have for anyone venturing into data visualization. It is not just an educational resource but also a source of inspiration
Probably my favourite data vis book so far! This book is a standout resource in the field of data visualization, particularly because of its practical approach, which is highly relevant for those involved in data analysis, BI development, or data science on a regular basis. Unlike many other books that cater to creating complex graphics for infographics and journalism, this book caters to the everyday needs of data professionals. It avoids delving into complex theories like visual perception, which, while insightful, aren't crucial for those whose main task is crafting clear and straightforward charts.
The author acknowledges that while there are no absolute rules in data visualization, he offers valuable 'training wheel' advice that can benefit anyone. I loved the cheat sheets that summarize lots of the advice in a useful reference.
This book is very enlightening and really helps me to answer the challenges I often face in making everyday charts. As a seasoned practitioner, Nick can provide many perspectives with detailed suggestions for many practical context.
The discussion chapters in the book are also well structured so it's easy to follow, especially with the takeaway box.