Do you want to identify top-performing funds in a category in one go using graphs? Have you ever wondered which fund can lose more during a market correction? Do you want to compare the funds’ performance during the market correction of Oct 2024 to Feb 2025?
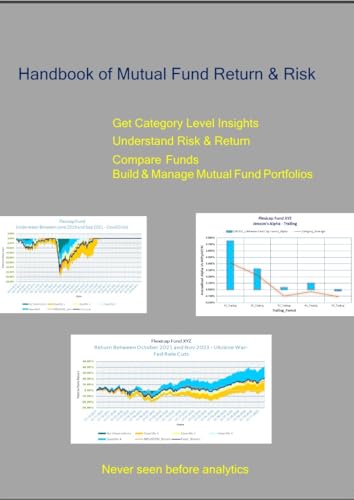
Handbook of Mutual Fund Return & Risk uses graphs and visualizations to present the long-term performance of mutual funds. The fund performance is arranged category-wise so that within category comparison is possible. It identifies top-performing funds in the category and makes a deep dive analysis of their performance. It highlights the recent performance of the funds in each category.
Make better decisions in selecting and managing funds using multiple cross-sections of periods using graphs and visualizations in the book
Category Overview based on 3-year trailing period data till Oct 2024 so that you get a bird’s eye view of top performing funds in a categoriesDeep dive analysis of return and risk of top performing funds in the category using various parameters and performance during past market crisis periods, like the Covid crisis and the Ukraine war/Fed rate cuts Recent performance during the market crisis of Oct 2025 and Jan 2025 for funds in every category so that you can compare how the various funds in the category performed during the crisis on various parametersUse multiple measures of return and risk to get a holistic and complete picture of fund performance
Use calendar year returns, trailing year returns, Jenson’s alpha, and SIP returns over several trailing year periods presented graphically to compare fund performance in an instant Use beta, standard deviation, and a set of risk measures used only by institutions to measure inherent risk in the funds Use multiple measures of risk-weighted return to evaluate fund performanceMany of the metrics, graphs, and visualizations are never seen before in the Indian market. Grab your copy now.