

What do you think?
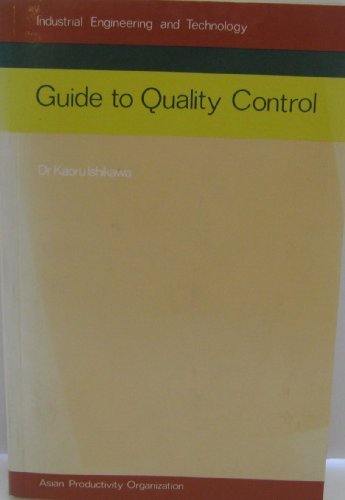
Guide to quality Control
Covers how to create and use the 7 basic tools of histograms, cause-and-effect "fishbone" diagrams, check sheets, Pareto diagrams, run charts, control charts, and scatter plots.
- GenresBusiness
226 pages, Paperback
First published January 1, 1982
Ratings & Reviews
Friends & Following
Create a free account to discover what your friends think of this book!
Community Reviews
Displaying 1 - 4 of 4 reviews

March 22, 2025
Before Microsoft Excel became pervasive for data analysis, this book would have been the gold standard for analysing production quality and identifying process improvements. I would have given it 5 stars during its printing run back in the 1980s.
With today's technology, much of the content is dated and we can use computers to shortcut most of the work but there are still some valuable foundational best practices to absorb. Ishikawa's method of defining cause & effect is still relevant and worth a read.
With today's technology, much of the content is dated and we can use computers to shortcut most of the work but there are still some valuable foundational best practices to absorb. Ishikawa's method of defining cause & effect is still relevant and worth a read.
May 14, 2023
روشهای نسبتا قدیمی و پایه ای کنترل کیفیت. بر اساس داده گیری دستی و رسم دستی نمودار.

July 22, 2013
Not a modern text on the subjects covered but it is one of the originals and by the master himself - hey, they named the fishbone diagram after him (as in Ishikawa diagram, not that his nickname was Fishbone or something). If you are new to the material, its here to be learnt and well explained.

March 10, 2012
Succinct, and to the point. Good starting place re: business statistics for lean management.
Displaying 1 - 4 of 4 reviews