Clustered yet scattered, we New Zealanders live across the country’s physical landscapes, experiencing its varied weather and environments. We co-create its political, economic and social systems on a daily basis. Each of us has a particular view of Aotearoa, yet nobody comprehends the whole.
This book’s sets of maps and graphics help New Zealanders make sense of their country, to grasp the scale, diversity and intricacies of Aotearoa, and to experience feelings of connection to land, to place, to this time in our history, and to one another. By making data visible, each graphic reveals insights about Aotearoa. They answer a range of questions: Who visits us? How many fish are in the sea? How equal are we? How do we hurt ourselves? Where do our cats go to at night?
This compelling mixture of charts, graphs, diagrams, maps and illustrations is functional, beautiful, insightful and enlightening. It tells us where we are, here, in 2018. Essays by some of New Zealand’s best thinkers complete the package.
Back in my school days, I neither liked or was any good at, maths. But I did like statistics and graphs and did OK in those classes.
And I'm a very visual learner, so something that I am shown makes more impression than something I am told about.
So this is the perfect book for me!
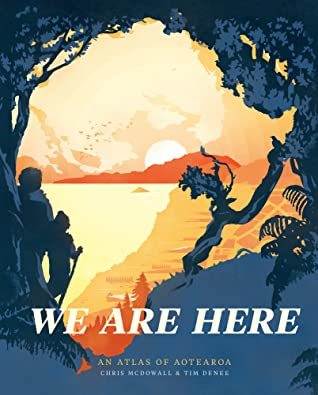
My favourable impressions started with the cover;
I love blue and orange together so this really caught my eye, when I was browsing through this year's Ockham Award winners (NZ Book Awards)
And these aren't dry facts and figures using a pie chart!
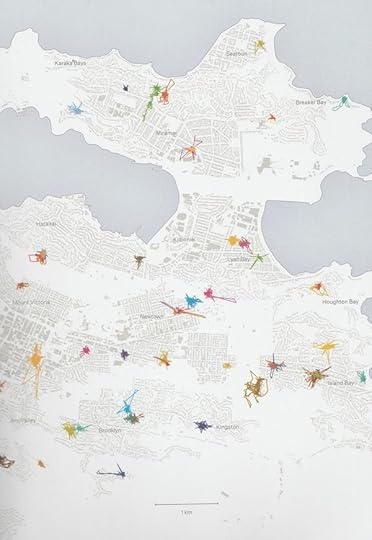
For example tracking the movements of 100 pet cats over a period of seven days in suburban Wellington.
Their owners may be surprised at how far "Marmite", "Zeus" and the other felines travelled!
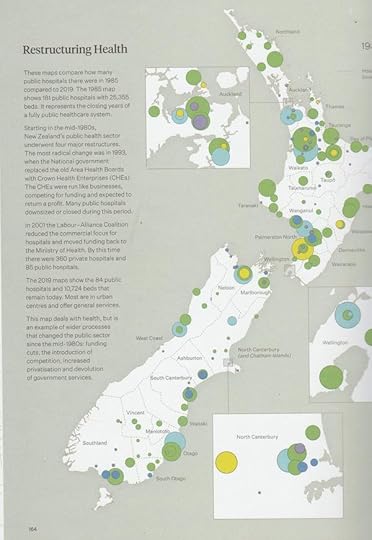
This is a big book, both in terms of food for thought and size so it isn't easy for me to scan the covers. But here is a map of New Zealand showing the hospitals we had in 1985.
Just too depressing to show the 2018 map.
This book may become historic quite quickly. I'm wondering if Chris and Tim have thought about a membership only website to keep their statistics current.
Brave to say “read” such a comprehensive collection of data displayed as maps and clearly explained information- but wow what a resource and what a fabulous collation of life on this place, the land of my birth. Fascinating. I imagine this may be a regular library borrow for me.
A really lovely work of information graphics - beautifully designed and illustrated - that thoroughly deserves its New Zealand Book Award. Hours of detail to examine, and perspectives on the threads of economy, ecology and humanity that form the thing called Aotearoa New Zealand.
Absolutely stunning. Chock full of data rendered into beautiful maps, infographics, graphs and tables, this book brings statistics to life. It's a great book for dipping in and out of at leisure, and learning about Aotearoa New Zealand, it's people, it's land, it's government, it's industry and so much more. This was a library copy I have been reading, but I may have to invest in a reference copy for my bookshelves at home.
It is beautiful beyond words. A genius creation that presents what could to some (read me) be insanely boring informations into an engaging format. I especially loved the graphics presenting how far cats travel in a week. So cute. Will be reading again and again.
This is a terrific book to dip into every now and then to get to know the nitty gritty of aspects of NZ life [and learn how to interpret maps, charts, graphs and diagrams - many of which are very inventive.] I was sad at having to return it to the library. Not everything is weighty; there is a lovely map of where cats go at night - potentially serious for bird's lives of course. All secondary and possibly intermediate schools should have some copies. While it will date it will point students towards reputable sources for future data. There's a good review here also https://thespinoff.co.nz/books/05-11-...
A gorgeous, thoughtful, and at times challenging combination of maps and data visualization, some better than others, but all created with an attitude of inquiry and experiment. The accompanying essays were of varying interest and quality. Only one was particularly tone deaf and of limited vision, although touching on important points. It was the end material that lifted this to five stars for me: explanations of terms, access to the code that produced the materials, and discussion of the data sources for each map or visualization.
One of the most interesting books I came across at the library this year, a great one to dip into. Statistics of NZ done in a very compelling coffee table type book.
This book is amazing! It is so comprehensive, so beautiful, so interesting, so insightful. My co-worker left it on her desk and I couldn't resist flipping through it all the time. It is a step up from any other reference work on New Zealand I have seen.
Beautifully produced. The chapter dividers and initial chapter essays are gorgeous. The maps themselves vary _ from interesting, elegant and thought provoking to a few that are harder to decipher.