

What do you think?
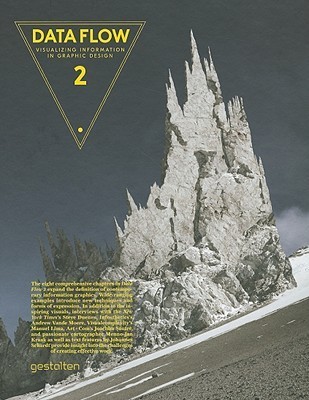
Data Flow 2: Visualizing Information in Graphic Design
International interest in the sophisticated and aesthetic visualization of complex information made Data Flow a bestseller. Today, more and more graphic designers, advertising agencies, motion designers, and artists work in this area. New techniques and forms of expression are being developed. Consequently, the demand for information on this topic has grown enormously. Data Flow 2 expands the definition of contemporary information graphics. The book features new possibilities for diagrams, maps, and charts. It investigates the visual and intuitive presentation of processes, data, and information. Concrete examples of research and art projects as well as commercial work illuminate how techniques such as simplification, abstraction, metaphor, and dramatization function. The book also includes interviews with experts such as The New York Times s Steve Duenes, Infosthetics's Andrew Vande Moere, Visualcomplexity's Manuel Lima, ART+COM's Joachim Sauter, and passionate cartographer Menno-Jan Kraak as well as text features by Johannes Schardt about the challenges in creating effective information graphics and about the relationship between complexity, clarity, content, and innovation. Offering practical advice, background information, case studies, and inspiration, Data Flow 2 is a valuable reference for anyone working with or interested in information graphics.
271 pages, Hardcover
First published March 29, 2010
About the author
Robert Klanten
229 books38 followersRobert Klanten has been a key figure in the global creative industry for more than a quarter of a century, helping to reimagine the way we approach publishing. He has driven over 800 publications and commercial projects.
Robert is the CEO of gestalten, the company he founded in 1995. Under his leadership, gestalten has established itself as a pillar in the field of contemporary visual culture, design and architecture, by immersing its readers in creative landscapes, cultures, people and art. gestalten regularly collaborates with the biggest names in the creative world and is known and loved by millions around the globe for its iconic books.
He has shown how creativity has no limits in the digital age: through inspiration, inclusivity and promoting understanding; and by connecting the global and the local through storytelling.
Robert is the CEO of gestalten, the company he founded in 1995. Under his leadership, gestalten has established itself as a pillar in the field of contemporary visual culture, design and architecture, by immersing its readers in creative landscapes, cultures, people and art. gestalten regularly collaborates with the biggest names in the creative world and is known and loved by millions around the globe for its iconic books.
He has shown how creativity has no limits in the digital age: through inspiration, inclusivity and promoting understanding; and by connecting the global and the local through storytelling.
Ratings & Reviews
Friends & Following
Create a free account to discover what your friends think of this book!
Community Reviews
Displaying 1 - 6 of 6 reviews

March 14, 2020
There are pie charts there. *Literally* pie charts!

October 9, 2010
I feel almost exactly the same about Data Flow 2 as I did its predecessor: a little more time spent translating and explaining the graphics would've aided the work greatly, but it's still a profound collection of visuals. There's humor, information, and artistry all wound together throughout the book. Thoroughly enjoyable, whether you feel like perusing a single graphic for an hour or flipping through the whole volume like a coffee table book.

May 16, 2010
I really enjoyed this beautiful book. It's filled with stunning images of information and data visualization as well as art. It organizes the visualizations by categories, basic types of visualization - which is great, because it allows you to see how even widely differing visualizations have common themes. Inspirational.

July 12, 2010
I paged through this in a bookstore. It is informative, large and expensive.

November 13, 2013
Who new data could be so interesting. A hefty book filled with ideas on how to visualise data that actually makes it interesting, engaging and memorable.

June 18, 2015
infographics FTW
Displaying 1 - 6 of 6 reviews