
Dominica Degrandis's Blog
October 23, 2022
Mapping Psychological Safety
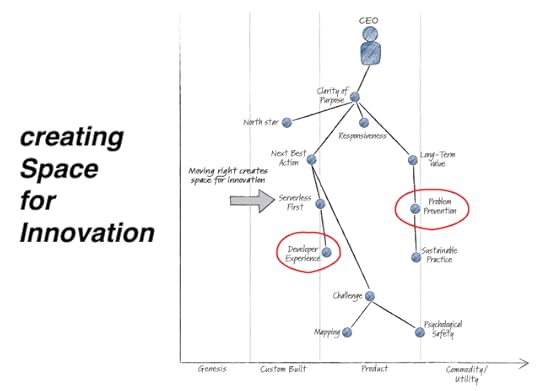
David Anderson has published a book called The Value Flywheel Effect. It’s about creating adaptive organizations to drive business results and modernize technical practices and cloud adoption. In his talk at DOES22 Vegas, he shared the Serverless adoption story at Liberty Mutual using Wardley Maps.
In one map titled “creating space for innovation”, I was stunned (perhaps shocked) to see “Psychological Safety” sitting on the cusp of the commodity column of the Wardley Map. I thought, “Wait! what? How can psychological safety be a commodity? You can’t buy it. It’s like trust – it has to be custom built.”
Luckily, I have The Value Flywheel Effect book – fresh off the press. Autographed by David no less! And there in chapter nine (Environment for Success) is a section on “Mapping Psychological Safety”, where a couple of characters in the book explore how far their organization has come and where they still need to work to better create a psychologically safe environment.
The dependencies listed in the map include trust (which requires leadership), and a safe to fail environment (which requires space to learn). These dependencies reside in the custom built column of the sample Wardley Map – which is where I would have thought to map them – and likely why I was so stunned to see the map above with Psychological Safety positioned on the cusp of commodity.
As David says, “Wardley mapping is a super power for building situational awareness.” If Psychological Safety is seen as a commodity, then the organization has a supportive environment for success. If the attributes that Psychological Safety is dependent on appear in custom built, then the organization has a ways to go to lay the groundwork for success. They will need to move those components to the right. It sounds so obvious, but seeing it on a Wardley Map accelerates a whole new level of awareness previously difficult to articulate verbally.
Assessing psychological safety can be made visible (via mapping)! Teams can show that a successful environment – one where people can challenge one another responsibly – is dependent on psychological safety – which in turn is dependent on trust, space and time. Wow – this is a game changer for my coaching sessions with customers – especially the ones afraid to challenge their boss.


October 9, 2022
Q&A: How to Scale with no Alignment on Value or Culture.

It’s time to answer another question that got voted up (in Slido.com) by other attendees after my talk at the Prodacity Conference.
“How can we scale in an organization with no alignment on value or culture?”
This is quite the question! Many large books could be written on this topic. My initial thought was, “I don’t think you can”. Upon further reflection I think there are tools available to tackle issues related to misalignment on value and culture. Tools that inspire people to be curious and ask practical questions in a positive manner. Tools that offer people a reason to get excited about forthcoming change. Some of these tools require self-awareness (the ability to recognize one’s own emotional state). One such nifty tool that you can start using today is working agreements.
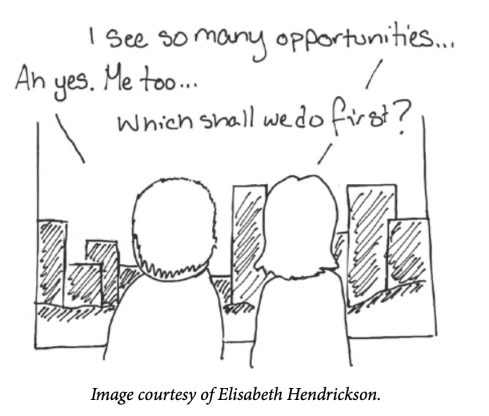
Working AgreementsWhile co-authoring the 2021 forum paper, Winning Together, it was Elisabeth Hendrickson who inspired me to take a deeper look at working agreements. In it, we discuss the benefits of doing your best to understand your counterpart’s situation and the pressures they are under.
Consider the following questions:
How do they define success?What are their near-term key business objectives?What measures are used to evaluate their performance?Listening to another’s perspective can go far toward improving alignment. Sometimes we just need to earn trust by demonstrating understanding.
There are likely things you can change about the relationship to strengthen the foundations of your partnership and set you up for better success. Start by identifying a few specific things that you need most.
For example, and some of my favorites, we need our counterparts (or customers) to:
Involve managers in plans being formulated, so they don’t feel circumvented/threatened and resist change Reduce WIP for those involved so they have capacity to learn and do things differently Make experiments visible & iterate Present learnings in a safe supportive space without judgmentPeople in other parts of the organization may not realize that the way they have engaged with you is making it harder for you to help them. And – they likely have requests of you too. The requests and agreements made as a result of these discussions can form the basis of a co-authored working agreement that will put you in a better position to bring coherence and integrity around organizational alignment.
Once working agreements are in place, jointly prioritize the opportunities and socialize them broadly. Crystal clear communication on the most important thing signals alignment and lays a foundation for culture change – often a massive messy marvelous journey.
September 25, 2022
Q&A: How to Convince Management to allow first steps?
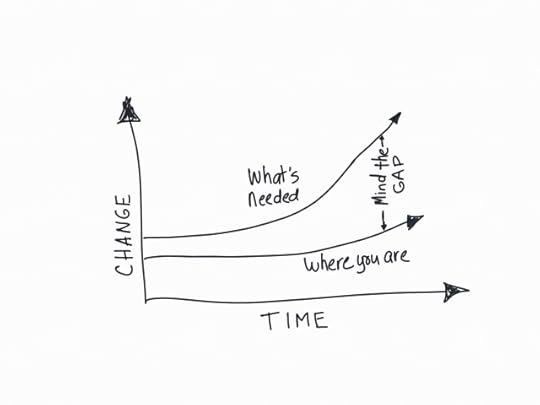 Mind The Gap
Prodacity conference attendees asked me a bunch of great questions at the end of my talk.
I didn’t have time to answer all the questions live and decided to answer them in blog posts. One question that got voted up (in Slido.com) by other attendees was:
“How to convince management to allow first steps (ex: lower WIP, allocate capacity for quality)?”
Convincing others to do things differently means asking them to change the way they work – a difficult task indeed. I believe that kind of change begins with:
A good reason to change The desire to actually changeThe courage to try something newSo – why Change? What’s the problem? And – what’s the opportunity? A graph like above is a powerful visual and can start the conversation on where you are and where you need to be.
For example, if the number one metric that your executives pay attention to is time-to-value, then capture your current time-to-value (Flow Time) and plug it into the graph.
What is your current capability when it comes to speed? If it’s remarkably different than what is needed, then that’s a good reason to change and may inspire management to try something new – as long as they are involved in the plans being formulated. Otherwise people may see the proposed change as a threat to their position, prominence, and self-worth.
Paint a picture with them of the three essential flow metrics (Flow Time, WIP and Throughput) to experiment on what the impact of lowering WIP can have on time-to-value. Provide a compelling opportunity for how to improve time-to-market and inspire others to tap into their desire to collaborate on creating the future. Where there is opportunity there is hope. Taking some action can breed confidence and courage.
September 11, 2022
How to Effect Change
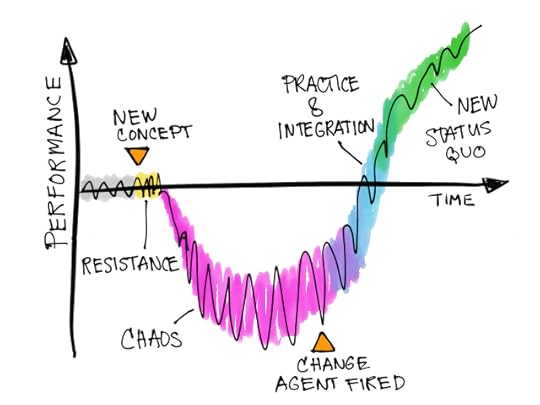 The J-Curve
The day the Obama’s were at the white house for the unveiling of their portraits, I was four blocks away attending the Prodacity conference. The conference was awesome due to many amazing speakers and a single track focus. First time on an airplane in more than three years, and first time speaking on stage at a live event, filled me with both overwhelm and relief. It felt like I needed to learn how to speak again in person and I was relieved to talk with attendees after the talk.
Over the last ten years, I’ve worked with lots of large organizations to help them roll out flow metrics. And because flow metrics tend to change the way organizations look at and measure value, my work is consumed with advising managers and directors on how to effect change. It hasn’t been easy as people are resistant to change and managers are rarely set up to enable change successfully. This is a really important topic and what I chose to speak about at Prodacity.
IntroductionThe uniform code of military justice specifies court martial for any officer who sends a soldier into battle without a weapon. There ought to be a similar protection for technology coaches, managers and directors, because they shouldn’t be made responsible for an initiative or transformation without being setup to effect change. That’s because change is inevitable and it’s good if it’s headed in the right direction. Quickly, as time is of the essence.
No company or organization can operate the same way forever. We all need to change at some point. How well your organization can change will be determined largely by three things:
Your ability to make work visible – so people can see how and what work delivers value.Your ability to measure what matters – so people can understand the impacts based on data.Your ability to build a coalition of the willing – so there’s a large enough group of people who actually want to change. Transforming organizations is not a one person job – no matter how competent they are.Here are a few ideas for how to make work visible and measure what matters so your ideas can be valued and accepted – which can help you build a coalition of the willing.
Make Work VisibleMaking work visible is one of the most fundamental things you can do to improve workflow. That’s because the human brain is designed to find meaningful patterns & structures in what is perceived through vision. Most people process information based on vision. For visual learners, if the right hemisphere is not activated and engaged, then attention will be poor. It’s why meetings are more compelling for two thirds of your team when there’s something interesting to look at.
I like to start making work visible by looking at demand (at work item types). Because it answers the question, “What kind of work do you do?“. And because it drives conversations on prioritization, such as, “Should we prioritize features or security this quarter?“
In 2018 Mik Kersten prescribed four work item types to use in software delivery: Features, Defects, Risks, and Debt. These are used by many companies measuring flow. The benefit of categorizing work this way is that it allows for rapid understanding of demand (work type demand) with a single glance. It’s also an easy way to allocate capacity and see ratio per work item type.
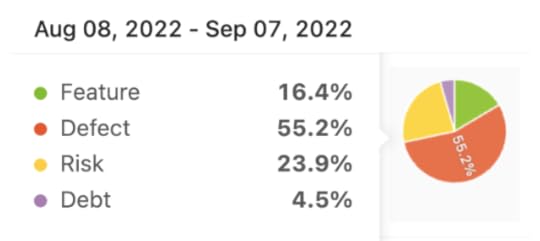 Flow Distribution
55% of completed work items over this 30 day interval is defects. Talk about provoking a necessary conversion! Is this what we thought it to be? What’s our strategy? What should it be?
Looking at your flow distribution at the end of each month to compare what you had wanted it to be is a useful exercise. If you have existing review sessions such as Ops review, I recommend using some of that time to look at flow distribution – so you don’t have to add another meeting to your calendars.
If ended up being 80% features and 20% defects, then we know that the strategy didn’t match the way work was prioritized – and there lies an opportunity to discuss tradeoffs. Flow distributions is really a measure of tradeoffs. If 100% of the work completed was features and defects, then there’s no capacity for security or tech debt. If you continue to do more feature work, you can’t expect it won’t take away from doing risk or debt work. Business and technology leadership need to understand these tradeoffs.
Measure what Matters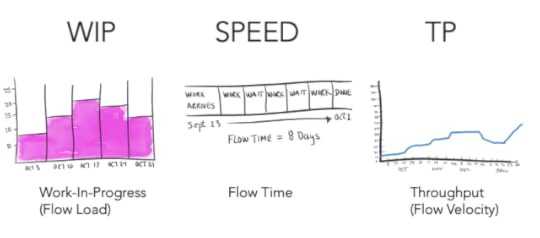 Three essential metrics
WIP is a great metric to look at first. Why? Because it’s hard to effect change with people who are cognitively overloaded.
I’m currently working with an operations team with an average WIP of nine per person. I asked them how they juggle nine things at a time? Turns out they don’t really – they set work aside to work on other things and 40% of their WIP sits idle.
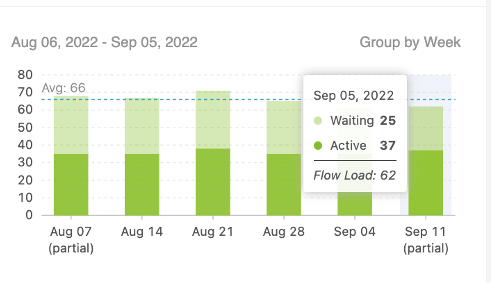 Flow Load reveals 40% work in wait state
50% of their work is unplanned. Because unplanned work delays planned work, it’s a real problem for them. Measuring their WIP (Flow Load) to see how much work sits idle prompted conversations on “Start finishing and Stop starting” and why pulling new things into progress before finishing old work delays Flow Time.
Flow Time: The elapsed time to complete a request from the time work begins to the time the request is available for the customer.
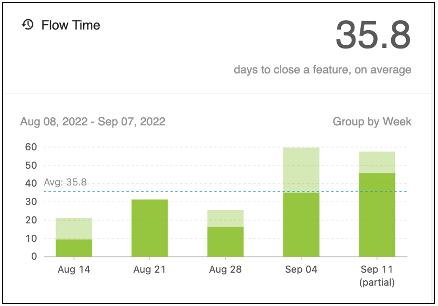 Feature Flow Time
There is a relationship between flow Load, flow time, and throughput – it’s called Little’s Law.
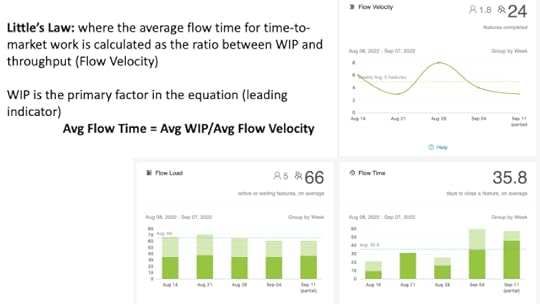 Infrastructure team flow metrics
The gist of Little’s Law is that – on average – the more items that are worked on during the same time interval, the longer it will take to finish those items – on average. Changing any one of these flow metrics can impact the others.
This infrastructure team delivers 24 things per week (approx. 1 per day) and each thing took 36 days to complete (on avg). Given Little’s Law equation above, solve for “Avg WIP” to see what the WIP should be based on Little’s Law. Remember to use the same units of measurement (days).
Note that Little’s Law is based on assumptions such as, the arrival rate should equal departure rate, all work started will be completed, the average age of the WIP is neither increasing nor decreasing. Think of Little’s Law as a tool to help guide you toward a better WIP limit – which won’t be precise – because -assumptions.
In SummaryMost companies our team works with at Tasktop (now Planview) struggle to perform like high-performing digital natives. When we examine Flow time in the end-to-end process of turning a business need into a business outcome, it’s a very long process – 6, 9, 12 months if not longer.
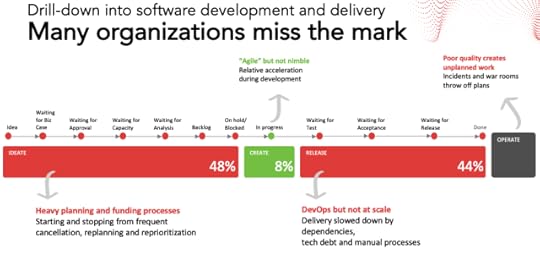 End-to-end Flow time
We call this water-scrum-fall, where development teams typically have relatively fast flow, but the overall time-to-market washes out that success. The time spent on actual development is often between 2-12% of the total time-to-market. More than half the time is spent in heavy planning & funding processes. And beyond a few instances where DevOps has worked, for most applications, releases are slowed down by cross-product dependencies, brittle legacy systems and high ceremony processes.
Adding more people or resources is not always the solution – especially when people are already overloaded. Getting new people up to speed make take months. The key is to make priorities visible, reduce WIP, and equip leaders to successfully effect change using metrics that matter. From there, the work will show you what to do.
August 27, 2019
Flow Metrics: How to Get Started Measuring your Value Streams
In this post, I’ll cover flow metrics — why teams use them, what they are, and my tips for getting started. A balanced set of flow metrics can be a powerful tool for reflecting your reality as a team. It can also be an effective way to communicate your reality to business stakeholders, using language that means something to them. But first, here’s a quick synopsis of how I landed on the structure of this post.
At the Agile2019 conference in DC, I was asked to distill my talk on data and metrics into a 10-minute circuit training session. My objective was to present one talk to six different groups over the course of an hour.
If you haven’t participated in a circuit training before, here’s how it works: Picture 500 people in a large conference room, gathered around six stations. Each station has a large round table, some chairs, a flipchart, and a speaker. Each group rotates from one station to the next at the direction of a timekeeper, who resets the clock for each 10-minute session. By the end of 60 minutes, everyone in the room has heard six, short presentations, each designed to deliver three actionable takeaways.
For my session on flow metrics, I started with “why” (as any proper Simon Sinek fan would do) before I dove into the “what” and “how.”
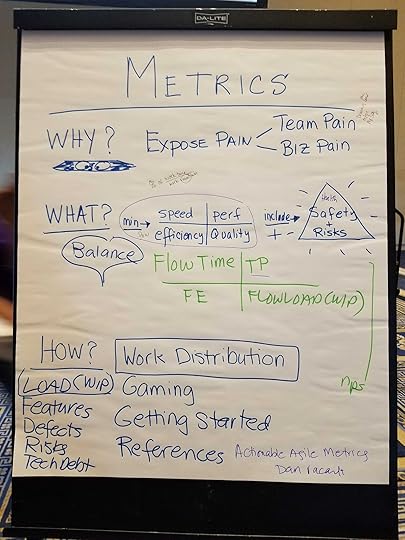
Why should we measure our work?
One of the biggest reasons for collecting data on our work is to provoke conversations with our colleagues around pain points we experience in certain areas. By “conversation,” I don’t mean gripe session; I mean a dialogue around the things we want to fix that can spark real change. Here are a few examples of the two main categories of pain points: team pain and business pain.
Common Causes of Team Pain
Overloaded people drowning in workToo many meetings, which contributes to being overloadedPeople held accountable or made responsible for work without being able to provide input on decisions — a feeling that you have no say and no influence in the work you do
Common Causes of Business Pain
Things take too longNo visibility on the status of requests — someone asked for something three weeks ago and they have no clue where it isLack of predictability — estimates don’t match up with intended delivery dates
What metrics should we measure?
At a minimum, I suggest capturing a balanced set of metrics — one that can address the internal pain points for both business and teams. Flow metrics, specifically those that capture speed, load, efficiency, and performance, are useful because they reflect the team’s reality and they can be linked to business value.
A balanced approach to measuring flow includes:
CategoryFlow MetricDefinitionSpeedFlow timeElapsed time for all activitiesPerformanceFlow velocity (throughput)How many items deliveredEfficiencyFlow efficiencyWork time/wait time ratioLoadFlow loadLoad on teams (WIP)
If you don’t lead with a balanced set of metrics, you risk developing data myopia. Let’s say, for example, that speed is the only metric you’re tracking, and the team’s load increases. The more load (i.e., work in progress or WIP), the more context switching you have, which leads to longer cycles, lower performance, and meager efficiency. If you’re only focused on improving one metric — and not comparing it to other metrics — it’s easy to miss the corresponding impacts of one metric on the others..
While I’ve focused so far on flow metrics that measure outcomes, I also think it’s important to capture the cultural aspect of your work. Consider introducing a “flow safety” metric to your toolkit to identify risks from dark debt. If people don’t feel safe if work items are flagged as blocked, or when they disagree with the priority of work, then work may become invisible, be done “under the table,” and not appear in the metrics.
How to get started measuring work?
Getting started with flow metrics takes planning and alignment. First, find a person from the business side who is willing to try something new. Maybe they’re in a state of crisis and willing to try anything — or maybe they’ve been reading up on the benefits of flow and value stream management and want to try it out. No matter what their motivation is, it only takes one astute decision maker on the business side to start a revolution. Once they show other decision makers the benefits of using flow metrics, more business stakeholders tend to follow.
After you’ve teamed up with your business partner, work with them to define a four-to-six week metrics adoption experiment, where you capture one new flow metric each week for your value stream until you’re tracking a balanced set.
For more information on using data and metrics as change agents in your work, check out these resources:
Making work Visible: Exposing Time Theft to Optimize Work & FlowProject to Product: How to Survive and Thrive in the Age of Digital Disruption with the Flow FrameworkFocused Objective Tools and ResourcesActionable Agile Metrics for Predictability Accelerate: The Science of Lean Software and DevOps: Building and Scaling High Performing Technology Organizations
Reflection
I’ll close this post by returning to my experience in the circuit training session and offering this short reflection: Ten minutes flies by fast. The next time I do something like this, I’ll cover less material and reserve more time for questions. I’ll also spend more time whittling my full talk into the most concise and critical takeaways for people to consume. All in all, the circuit format seemed to resonate well with people who attended the conference. I was honored to participate as a speaker and look forward to the next gathering.
July 23, 2019
Saying No doesn’t make you an arse
“The difference between successful people and very successful people is that very successful people say “no” to almost everything.” ~Warren Buffett
Do you ever feel like you’re overwhelmingly
overloaded at your job? If you said “yes,” you’re not alone. Having too much
work to do — and not enough time to do it — is a way too common scenario.
Sometimes burnout cultures play a role in chronically overburdening people. But often, the problem is not our boss, our co-worker, or the person who Slacks at 4:56 p.m. with an urgent request. Many of the reasons we’re overwhelmed start when we say yes when we really ought to say no.
You have more power than you realize over your workload. When people ask you to do stuff, they don’t know everything that competes for your time. It’s up to you to communicate the full picture. It’s your choice on how to use your time. While it’s uncomfortable to say no, it’s often the right thing to do. Saying no doesn’t make you an arse.
Saying no is a learned skill, and it helps to
practice. At the DevOps
Enterprise Summit in London last month, I outlined seven
everyday scenarios for saying no and exactly how to say it. These strategies can help you avoid
overburdening yourself and become better guardians of your time, your most
precious resource. You can get more money, but you cannot get more time.
7 Ways to Say “No” to Everyday Requests
#7
Someone else’s emergency… “I know you’re busy, but…”
Your colleague needs help with the printer. If
you allow yourself to be pegged as the printer fixer, you can count on frequent
interruptions and context switching. Don’t assume that your colleague’s work is
more important than your work.
Your Response: “I can’t do it this minute. I
can show you later how to fix the printer
going forward. Or just open the printer and follow the instructions.”
#6 A major contributor leaves the company… “Can you cover Brent’s workload until the new hire starts?”
Take time to mull this over before responding too quickly. Some healthy stalling tactics can get you off the hook until you are certain. When possible, delay your answer until the most irresponsible moment (perhaps after the new hire starts:-)
Your Response? “I’m flattered that you think
so highly of me. Let me get back to you.”
#5 The Boss’s pet project… “I have a great opportunity for you!”
Your boss wants your help to finish Project Sally. It’s hard to say no to the boss,
especially when they make you an offer you
can’t refuse. When you hedge a no, you can buy extra time.
Your response? “Let’s look at all the things
we are trying to do right now. Can we set a time next week to discuss my team’s
priorities to see what could be dropped in order to make time for this
request.”
#4 Got
a minute?… “Because I have this 20-minute thing to
chat about.”
Your teammate wants a minute of your time to run something past you, but it’s not the best time for you. Delaying the conversation until later will help you finish your most important work of the day. Remember that unplanned work delays planned work. Your whole day could be consumed by five minute interruptions if you let them.
Your Response?
“Sorry. Nothing really takes just one minute.
I’m in the middle of something right now. Can we catch up later today?”
#3 Please maximize your time for my benefit… “While you’re at lunch, can you pick me up some aspirin and black socks?”
You might feel like you need to list all the reasons why you can’t run other people’s errands. But in some cases, there is no need to make excuses, and it’s just best not to elaborate. “No” is a complete sentence.
Your response?
“Sorry, but no.”
#2 The after-work happy hour invite… “Come on – we’re going out for drinks.”
Everyone wants to form positive relationships with his or her team. But socializing after regular work hours or outside of the office isn’t for everyone. Fortunately, you can use your personal time to set some boundaries. And, similar to your response for scenario number three, you don’t need to elaborate.
Your Response?
“Thanks so much for the invite! But I have a conflict.”
#1 The big favor… “Can you cover the meeting for me?
On something like this, consider the tradeoffs. It could be that there’s a win for both of you. You could respond with, “I’ll take you up on that — if you will cover the meeting for me.
What will you choose to do today?
Being overloaded at work can make you feel
powerless, ineffective, and exhausted. When you’re struggling, tally up how
much you’ve said “yes” lately. See if there’s a connection. If you’ve accepted
work that’s outside of your priorities, examine how it has affected your
progress on the more important stuff. If you notice delays, then try using the
strategies in this post to recapture your valuable time.
Remember:
If you are going to finish your
day’s work (or your life’s work), then you must reserve time to do it.A decision to do one thing is a
decision to delay something else.
Liberate yourself from the habit of saying yes. “No” is an honorable response to someone asking you to do something that’s not in line with your goals. “No” does not make you an arse.
October 29, 2018
Three Learnings from DOES18 Vegas
It’s my 5th year speaking at the DevOps Enterprise Summit. I’m inspired more than ever after last weeks event in Las Vegas. We learned how a couple of IT leaders collaborate with business leaders in Legal and Product to address obstacles preventing IT from taking advantage of open source and fixing technical debt. We learned from repeat experience reports on what’s working and what’s not working inside large enterprises. And Lean Coffee rocked again with over 100 participants discussing everything from “Agile PMO” to “Transformational Leadership”.
There were so many great talks. The three most ingrained in my brain one week after DOES are ones that I think will have a big impact on how we think about the way we work in the future.
Past Success Doesn’t Matter
In his talk, Supercharging your career and how transitions produce new winners, Jeffrey Snover says, “It doesn’t matter how much success you’ve had in the past. What matters is, are you great at something that moves the biz forward now?” This resonates with me because it validates the fact that everything is always changing. If you attempt to stay the same, you actually fall behind. To remain relevant, one needs to continuously learn and adapt. This is why feeling uncomfortable is normal – it’s so easy to fall behind.
Jeffrey goes on to say that the only way to succeed with Digital Transformation is: 1) Create bandwidth from existing work, and 2) Invest in innovation. Jeffrey suggests leveraging cloud, DevOps and SaaS to free up talent. To this list, I’d add – improve the flow of communication, because the hardest thing we do is communicate across teams.
Working Late Every Night Doesn’t Improve Quality
Dr. Christina Maslach presented her research on burnout and job stress in her talk, Understanding Job Burnout. The number of employees inflicted with work related burnout and chronic depression is increasing – especially for people with a passion for solving problems, such as in healthcare, social justice and IT. No matter how hard we work, we never get enough done. The price people pay is high in health problems and loss of self-worth.
Dr. Maslach’s workplace burnout interventions include a supportive work community, choice & control, and something near and dear to me – a sustainable workload. High utilization levels don’t enhance productivity or the bottom line. When people are loaded to maximum capacity, it opens the doors to more dependencies, more interruptions, and more conflicting priorities. With a sustainable workload, people can get a sense of focus, flow and joy from creating and finishing something important – a job well done does wonders for self-worth.
Project Oriented Management Doesn’t Cut it
It wouldn’t be a DOES conference without the unveiling of a new book. Attendees stood in long queues to get a signed copy of Project to Product: How to Survive and Thrive in the Age of Digital Disruption with the Flow Framework.
In his talk, How Value Stream Networks will transform IT & Business, Mik Kersten describes how fragmented value streams kill productivity. When team X is unaware of impacts from team Y, the results are expensive. As mentioned earlier, the hardest thing we do is communicate across teams. Essential communication of mutually critical information between teams’ plummets when handoffs are invisible – or lost in email.
A software value stream with connected handoffs speeds up the flow of work on its way to production. These value stream connections are nourished by a product-oriented management model, where IT is considered a profit center (not a cost center), where funding is based on value streams (not projects), and where options remain open (not slashed upfront).
The Learning Continues
The DOES community loves to learn and share ideas. I am so lucky to have had another chance to visit with speakers I admire and attendees who make their workplace better. I can’t wait to hear what Gene and Margueritte have in store for us next year.
March 3, 2018
Keeping Players Fit & Safe
While writing an article on performance for work, I stumbled across a study titled, What’s in a game? A systems approach to enhancing performance analysis in football. It covers the physiological, technical, and tactical components of football to determine key performance indicators that predict successful performance.
The study acknowledges that football is a complex sociotechnical system – where humans interact with technical aspects of an organization within a constantly changing environment. Like when football (soccer) players wear GPS vests to track distance, speed, deceleration, etc…
Sociotechnical theory is about joint optimization of excellence in both technical performance and the quality in people’s work lives. But Sociotechnical theory is founded on two main principles, one of which is that the interaction of social and technical factors create conditions for both successful and unsuccessful organizational performance.
Sports teams go to great lengths to keep players fit and safe. Player availability and fewest players injured are key measures captured. So is the amount of money paid annually to injured players:
Baseball: $700 mill
NFL: $450 mill
NBA: 350 mill
Premier league: $300 mill
This got me thinking – how does “keeping players fit and safe” play out in the technology domain? According to Occupational Health and Safety estimates, $20 billion is paid annually to workers due to musculoskeletal disorders such as fibromyalgia and repetitive motion injuries such as carpal tunnel syndrome. Those who work hunched over a computer all day can attest to the soreness and fatigue that sets in due to poor ergonomics. These examples of “bad interactions” between humans and machines are often unexpected and unintended – a result of a sociotechnical system that neither works smoothly together, nor optimizes performance.
Compound these physical ailments with the conflicting priorities that tech workers juggle while learning new skills, and responding to system outages and incidents at all hours, and we have an indicator for burnout. When people become disengaged with their work and feel a general sense of apathy, stress levels rise. Computerworld’s 2017 IT salary survey found that 46% think their job is either stressful or very stressful, with 18% saying their job is more stressful this year than it was the previous year.
The long hours and constant demand result in a load that cannot be maintained – no matter how much people love their job. Eventually, overloaded people find themselves exhibiting burnout symptoms – physical and emotional exhaustion, cynicism and detachment, and feelings of ineffectiveness and lack of accomplishment.
Sports teams measure players using GPS systems and heart monitors, and questionnaires. Some coaches also take a personal approach. I like what Leicester City Head of Fitness & Conditioning, Matt Reeves says, “You can get carried away with all the automated data, so sometimes you can’t beat just asking a player how they feel, We take a holistic approach and try to make it more personal by understanding each individual.”
How do tech organizations gauge the fitness and safety risks of their people before it’s too late? Predictive analytics help. Similar to sports, self-reporting has its advantages. In their DevOps Metrics article, Mik Kersten and Nicole Forsgren state, “Monitoring job satisfaction proactively (through survey data) and not just reactively (through turnover metrics in HR databases) should be a priority for all technical managers and executives.”
Rarely have I been asked how I’m doing from a health/fitness/safety perspective. When that rare gem-of-a-manager does sincerely ask me how I’m doing, I feel blessed.
Granted, premier football players make a gazillion dollars. But what’s the real cost to the business when people burnout? Given the potential for fatigue, anxiety and burnout to occur (from too many hours hunched over laptops and phones), how can we enable excellence in both technical performance and quality in people’s work lives? How about we take a cue from Leicester City and simply ask people how they are doing from a fitness and safety perspective? #FTW
January 29, 2018
Visualizing 5 teams work on one board – take 1
I rolled out the new 2-day “Flow 101” workshop last week to 24 folks working at a financial services company near Austin. Notable in a couple of ways: 1) Two VP’s attended and 2) Three attendees from three different teams (the team of three), worked together to design a board to visualize the workflow across five different teams.
Usually, if a VP shows up at all, it’s only to introduce me before heading off to their triple booked calendar. That two VP’s took the time to participate in the workshop exercises with their teams signaled their desire and support for change. It’s much easier (if not essential) for people to improve flow knowing that leadership has their back. This author defines flow as “work pulled through a system smoothly and predictably.”
Usually, individual teams stay in their own groups and design only their teams work board. That people from three different teams collaborated on the exercises signaled a level of maturity of how important is to make the end-to-end workflow visible. It’s easier to see the bottlenecks in the system and achieve smoother flow when handoffs between different teams are visible. Improving flow requires a mindset shift. A shift that DevOps is influencing to view work flowing across the whole system (making flow time measurable) versus a narrow focus on small siloed teams.
During an exercise early on day one, the “team of three” identified four problems from the business perspective.
Not fast enough
Don’t know status
Unknown problems impact delivery
Low throughput
This led to the desire for this group to create a board that would allow them to capture the actual speed (flow time) of the work and visualize the status of their work – including handoffs of the work between the five teams (Maintenance team, Client implementation team (new clients), Core systems team, SQA team, and UAT (a business team). The team of three included representatives from: DEV, SQA and Maintenance. When it comes to improving the “Not fast enough” problem, one must discover how long things actually take to do — end-to-end.
Instead of creating three separate team boards, the team of three included work from five different teams on one board. This will make work status visible (including handoffs) and put them in a good position to measure their flow time (the elapsed time work takes to move from beginning to end), that would otherwise be invisible due to the siloed nature of the teams.
The “Ready” columns serve as wait states for between teams. Work sitting in “Ready SQA” is the handoff between DEV and SQA. Work sitting in “Ready for Prod” is the handoff between UAT and Implement. I’m curious to learn what the criteria is for moving work from “Review” to “User test”. The colorful cards on the board represent the different project work-in-progress.
This approach should help them address the “Not fast enough” problem as they will be able to measure the flow time from when DEV is first assigned the work to when the business value delivered to external customers, including any wait time due to handoffs between teams. They’ll have visibility on an important section of their value stream.
Because people should be involved in the design of the board that manages their work, I asked the team of three what their strategy was for getting buy-in from the other two teams. Their plan is to set up a prototype physical board of their initial design and invite the others to review it. They plan to train other team members on the process. They expect to have some wins and believe the others will want to join the fun.
I’m excited to hear how it goes and to see pics of their “big” board during our workshop follow-up call. More in a few weeks!
January 6, 2018
Q&A with Gene Kim
Recently, Gene Kim and I discussed my new book, Making Work Visible.
GK: What is it about visual cues that make them so effective?
DD: Images are easily received by the human eye, so the eye is naturally attracted to them. When used for visual cues, images, along with a few well-placed words, are quickly absorbed by the eye, making them easy to understand. We need little education to get the message. The combination of images and writing responds to our need for a nimble, unified language to be used across an organization. In contrast, a litany of acronyms and lingo is commonly used to communicate across different departments where people seem to not speak the same language.
GK: What are the top mistakes you see being made by leadership when trying to manage their team’s time?
DD: Mistake #1: Leaders (and just about everyone else) think that work can’t possibly take that long to do. But things always take longer to do, primarily because people are overloaded. The desire to keep people busy all the time (a faulty perception for optimizing costs) doesn’t take competing priorities into consideration. The more work piled on people’s plates at the same time, the more opportunity for time thieves to do damage. Dependencies and unplanned work grow with each new work request, and this work expands to consume more capacity than people have to do the work. The desire to keep people busy 100% of the time actually slows down the rate at which people can finish work.
Mistake #2: Creative workers such as developers, designers, and writers need large blocks of uninterrupted time to do their work well. It takes time to get into the zone when creating. An hour is barely enough time for developers to get started working on a solution to a complex problem. It’s one reason why developers hate meetings—an interruption at an inopportune time can blow a whole day. Smart managers understand the need for creative folks to work uninterrupted in two-hour chunks, and they avoid scheduling meetings during prime creative time.
GK: What’s the most impactful learning you have had working with kanban and other visual methods of tracking work and flow? Why?
DD: Given a visual to look at, people can stand together to see meaningful and relevant info with which to make decisions from. Well-designed kanban boards provoke necessary conversations, such as conflicting priorities and bottlenecks in the system. From the right perspective, visuals can help people understand that most problems lie within the system (rules, governance, the way people are measured) and not so much with individuals. The system then becomes the thing to improve, not the people.
To read the full Q&A session, check out https://itrevolution.com/qa-dominica-degrandis-gene-kim/
Making Work Visible: Exposing Time Theft to Optimize Work & Flow is now available for purchase at all major book retailers in print, ebook, and audiobook formats at https://itrevolution.com/book/making-....
Dominica Degrandis's Blog

- Dominica Degrandis's profile
- 18 followers


![[image error]](https://i0.wp.com/ddegrandis.com/wp-content/uploads/2018/01/IMG_swbc-DEV-board-resized.png)
![[image error]](https://i2.wp.com/ddegrandis.com/wp-content/uploads/2017/09/cropped-MWV-cover-3D-NEW.jpg)