Kenneth S. Rubin's Blog
May 18, 2025
Rebuilding Trust in the System: Visibility, Accountability, and Flow

In our ongoing series on moving from busy to flowing, we've examined how organizational flow can be disrupted by multitasking, dependency friction, and misaligned value streams. But even when the technical aspects of delivery are optimized, there's a more human constraint that can bring everything to a halt: a loss of trust.
When stakeholders no longer believe in the system—in the data, in the process, in the teams—flow collapses. Meetings multiply, approvals proliferate, and delivery grinds under the weight of oversight. In this article, we explore how restoring trust through meaningful visibility and flow-based accountability can counteract this bureaucratic drag. We'll look at how leaders can use flow metrics to rebuild credibility and create an environment where autonomy and alignment reinforce each other.
The Trust BreakdownTrust is the foundation of high-performing organizations. But when delivery falters or expectations are repeatedly missed, stakeholders grow skeptical. In response, they demand more status meetings, more documentation, and more sign-offs. These control mechanisms are designed to prevent failure, but they often have the opposite effect: they paralyze teams and obstruct flow.
What starts as a desire for oversight ends as a bureaucratic morass. Teams feel micromanaged. Leaders feel out of the loop. Delivery suffers. And ironically, the very actions taken to increase confidence in the system erode it further.
The result? A vicious cycle of distrust and dysfunction.
Why Visibility Is the First Step Toward TrustTo break the cycle, we need to replace guesswork with clarity. That starts with visibility. But not all visibility is created equal. Traditional metrics like hours worked or tasks completed tell us little about true progress or delivery capability.
Flow metrics—such as Flow Time, Flow Efficiency, and Flow WIP—tell a different story. They reveal how work moves through the system, where it gets stuck, and how long it takes to deliver value. These are not vanity metrics; they are operational truths. And when shared transparently, they provide a common language for both teams and stakeholders.
Visibility, when grounded in flow, removes the need for constant status checks. It shifts the focus from output to outcomes. And it allows everyone to see the same reality, in real time.
Accountability Without MicromanagementTransparency isn't a performance; it's a shared understanding.
Accountability often gets misinterpreted as control. But in flow-centric organizations, accountability is about owning outcomes, not managing activity.
When teams understand their Flow Time targets or their expected contribution to an Outcome Value Stream, they can take responsibility for improving the system. And when stakeholders see accurate, timely flow data, they no longer need to chase updates or question intent. The system speaks for itself.
The key is to design dashboards and metrics that reflect end-to-end flow. This means avoiding siloed reporting that only shows a sliver of the truth. Instead, leaders should co-create visualizations with teams to ensure the metrics support both insight and action.
Flow-based accountability promotes autonomy. Teams are empowered to improve. Leaders are empowered to lead.
Reducing Bureaucracy by Restoring CredibilityAccountability without trust is surveillance. With trust, it's ownership.
Most reporting layers exist to compensate for a lack of confidence. When delivery is opaque or inconsistent, stakeholders fill the gap with process.
But what if the system itself was trustworthy?
Imagine an outcome flow stream with live, accurate flow metrics available to every stakeholder. Imagine portfolio discussions anchored in Flow Load and delivery forecasting based on historical Flow Time. In this world, reporting isn’t eliminated; it’s automated, contextual, and meaningful.
Credibility is restored not through heroics or promises, but through systemic evidence. When leaders see consistent throughput, predictable cycle times, and clear bottlenecks being addressed, they begin to trust again.
Flow restores that trust.
Practical Next Steps for Leaders Diagnose the Trust Deficit: Identify where distrust is manifesting—excessive reporting, decision paralysis, frequent escalations. Introduce Flow Metrics Transparently: Don’t weaponize data. Use it to illuminate reality, not to assign blame. Align Around Outcome Value Streams: Shift focus from individual tasks to end-to-end delivery of valuable outcomes. Co-Create Dashboards with Teams: Let those closest to the work help define what metrics matter. Lead by Example: Use flow data in executive discussions and decisions. Model the behaviors you want to see.Credibility isn’t built through control. It’s earned through the consistent flow of outcomes..
ConclusionFlow thrives where trust lives. And trust grows where flow is visible.
Rebuilding trust in the system doesn’t require more control—it requires more clarity. By grounding visibility in flow metrics, leaders can reduce friction, elevate accountability, and foster a culture where delivery becomes a shared achievement. When trust is restored, flow returns.
Trust isn’t a feeling. It’s a system behavior. Design for it.
If your organization is bogged down by reporting cycles and trust gaps, let’s talk. We can help you design a flow-based visibility system that restores credibility and accelerates delivery.


May 12, 2025
From Metrics to Mindset: Creating a Culture That Supports Flow
This is the sixth article in our series, From Busy to Flowing, which explores how to unlock sustainable agility by improving how work flows through your organization—not just how busy your teams are.
In previous articles, we’ve examined the structural and systemic barriers to flow—multitasking, dependency friction, poor metrics, and fragmented value streams. But even the best-designed systems will stall if the culture doesn’t support them.
In this article, we explore how leaders can create the mindset and cultural foundation necessary to sustain flow over the long term—turning metrics into learning tools, aligning behaviors with flow principles, and fostering trust, autonomy, and fast feedback.
Metrics Without Mindset Are MisleadingFlow efficiency isn’t just a management toolset. It’s a leadership worldview.
Flow metrics like Flow Time, Flow Efficiency, and Flow WiP are powerful. They make invisible queues visible. They highlight where work waits, not just where it’s being worked on. They uncover system-level constraints that throughput-obsessed dashboards tend to ignore.
But without the right mindset, metrics can become:
Punitive tools used to chase local optimization Gaming targets that incentivize speed over quality Static snapshots in a constantly evolving systemUsed well, metrics foster learning. Used poorly, they kill trust.
Leaders set the tone for how metrics are used. That starts with treating metrics not as judgments of individuals, but as signals about the health of the system.
From Resource Utilization to Flow EnablementMetrics should provoke curiosity, not fear.
Traditional management logic rewards resource efficiency—keeping everyone busy. But busyness and flow are not the same. In fact, they often conflict.
Organizations built on resource efficiency tend to reward:
Maximized capacity usage (everyone always “at 100%”) Cross-functional context switching (keep them “fully allocated”) Local optimization (make your team look good, even if the system suffers)Flow-focused organizations prioritize:
Slack in the system to handle variability Stable, empowered teams aligned to outcome streams End-to-end ownership with fast feedback and learningThis is not just a tactical shift—it’s a cultural one. It demands a rethinking of what “good management” looks like.
What Leaders Model, Teams RepeatBusy isn’t the goal. Flowing to outcomes is.
Culture doesn’t change through training. It changes through behavior—especially that of senior leaders.
If a leader says they value agility but still:
Interrupts teams for status updates Uses utilization as a performance measure Funds short-term projects over long-term capability building…then teams get the message: flow talk is just talk.
Flow-supporting cultures require leaders to:
Ask better questions (e.g., “Where is work waiting?” instead of “Why aren’t we done?”) Celebrate learning and throughput, not just heroic efforts Invest in systems thinking, not individual blamingAutonomy, Trust, and Fast FeedbackLeaders must model respect for the system, not just put pressure on the people in it.
Sustainable flow thrives in cultures where:
Teams are trusted to manage their own work Decisions happen close to the work Feedback loops are fast, frequent, and safe Failure is treated as a learning opportunity, not a career riskMetrics can support this—but only if they’re used as invitations to improve, not as enforcement mechanisms.
The Shift: From Managing People to Managing SystemsYou can’t accelerate flow in a culture that slows down trust.
One of the most profound mindset shifts in a flow-first culture is this:
Leaders stop managing people doing the work. They start managing the systems through which work flows.
This means focusing less on:
Task tracking and time spent Individual performance reviews based on outputs Micromanaging priority changes week to weekAnd focusing more on:
System constraints and where work is getting stuck Clear interfaces between teams and value streams Strategic flow load management to avoid overburdening the systemLetting Metrics Lead You to Culture ChangeIf you want better outcomes, stop managing effort and start managing flow.
Ironically, one of the best uses of flow metrics is to reveal the cultural assumptions that are undermining performance.
Ask yourself:
Do we react to slow flow times by blaming teams, or by asking what’s blocking them? Do we overburden our highest-flow teams with more work, assuming they can “handle it”? Are we using efficiency metrics to prioritize learning—or to preserve the status quo?Every organization has a culture. The question is: Does yours support flow, or suppress it?
Closing Thought: You Can’t Metric Your Way to FlowYour metrics will tell you where to improve—if your mindset is ready to listen.
Metrics are critical. They create visibility, enable improvement, and help align the system.
But without the right mindset—rooted in trust, systems thinking, and a bias for learning—they won’t create lasting change.
Leaders must go first. They must show that sustainable flow is not just an operations goal—it’s a leadership commitment.
If you’re ready to explore how to build the cultural mindset that enables sustainable flow, contact us to start the conversation.
May 3, 2025
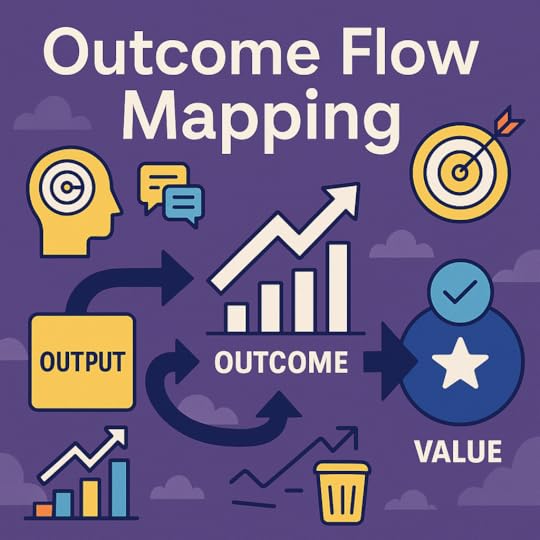
Outcome Flow Mapping: Why We’re Moving Beyond the Term ‘Value Stream Mapping’
For many years I’ve specialized in helping organizations improve how work flows across teams, departments, and systems to deliver meaningful results. One of the most commonly used tools in that effort is value stream mapping (VSM)—a powerful technique from Lean that helps teams visualize and analyze how value is delivered.
Value stream mapping is a catchy and often unfamiliar term in many organizations. In these environments, the phrase carries no historical baggage. Its Lean manufacturing origins are typically unknown, so introducing the term usually works just fine. In fact, I have successfully applied this term for many years.
Why We Need a New TermAs I’ve continued to work with more diverse organizations—particularly those outside of traditional manufacturing or those not organized around formal value streams—I’ve found that reusing the term “value stream mapping” can often create confusion without any offsetting benefit from using the term. Here are three of the more important reasons why:
1. Reusing a term outside of its intended context
2. “Value stream” can prompt tunnel vision
3. “Value and outcome” are not the same thing
Let’s explore each in more detail.
1. Reusing a Term Outside of Its Intended ContextUse the term value stream mapping in a Lean manufacturing context and there is fairly universal shared understanding of what that means and the practices that it entails. Outside of Lean manufacturing, it invites questions like, “Is what we’re doing really value stream mapping in the Lean sense?” In many cases, the answer is no, or certainly not in its entirety.
In the strictest sense, the term “value stream mapping” doesn’t actually describe what we’re doing when we model flow in an organization. So, rather than stretch or reinterpret a term with a very specific meaning in Lean, I’ve begun using the new term: Outcome Flow Mapping.
Using this new term, I explain that we’re mapping how work flows to deliver meaningful outcomes—a framing that resonates with most teams and leaders. The emphasis on “outcomes” feels right and aligns with many corporate goal-setting frameworks like OKRs.
2. “Value Stream” Can Narrow the Focus Too EarlyWhile value stream mapping emphasizes “value,” the technique is typically centered on a specific type of flow—what Lean calls a value stream, such as a product, service, or customer-facing business process.
But in modern knowledge work, we often analyze the flow of work across units of focus that aren’t formally defined as value streams. These might include:
• A product or product line
• A business capability
• A customer journey
• Or yes, a formal value stream, if that’s how the organization is structured
Calling every one of these a “value stream” can feel forced—and can make the mapping technique seem inaccessible to teams who aren’t organized around that concept.
The term Outcome Flow Mapping is intentionally more flexible. It highlights that we’re mapping the flow of work toward a meaningful result, regardless of what kind of unit of focus we’re working with.
3. “Value” and “Outcome” Are Not the Same ThingThe more significant reason for preferring the term Outcome Flow Mapping over Value Stream Mapping is that value and outcome are not the same thing.
• An outcome is a measurable result you want to achieve—a change in behavior, performance, or experience.
• Value is the benefit derived from that outcome—and it’s often subjective, context-dependent, and time-sensitive.
For example:
Outcome: Increase 30-day retention by 10%
Value: Higher customer lifetime value, reduced churn costs, improved forecasting
You can measure both outcomes and value—but outcomes are typically easier to measure directly, while value often requires interpretation about what matters, to whom, and why.
We also include outputs in this analysis for completeness, as they are often confused with both outcomes and value.
To illustrate these distinctions, let’s look at three examples: OKRs, assumption validation, and a humanitarian aid scenario.
OKRs (Objectives and Key Results)OKRs are a goal-setting framework used by many organizations to define what they want to achieve (objectives) and how they will measure success (key results).
Well-crafted OKRs define an outcome as a measurable goal, not an activity.
Objective: Improve user engagement
Key Result: Increase weekly active users from 15,000 to 25,000
This key result is a clear outcome—a specific change in user behavior. However, it is not in itself the value. The value might be improved customer retention, increased revenue, or more upsell opportunities that result from greater engagement. Value is derived if the outcome holds and is sustained.
Many teams mistakenly write OKRs that reflect outputs:
❌ Launch onboarding redesign
❌ Publish five new knowledge base articles
❌ Complete CRM migration
These are outputs, not outcomes. They describe effort, not impact. By focusing on outcomes and understanding the value they are meant to unlock, teams clarify what success looks like—and then use assumption validation and experimentation to discover how to get there if the path is uncertain.
Assumption ValidationMany modern organizations pursue outcomes using an iterative, hypothesis-driven approach. In this approach:
• The outcome is the goal: what you’re trying to achieve.
• The assumption (or hypothesis) is your belief about how to achieve it.
• The output is the prototype, experiment, spike, or minimal implementation (e.g., minimum viable product) you build to test that assumption.
• Validation is the process of testing whether the assumption holds—not whether the outcome is valid.
Example:
Outcome (goal): Increase 30-day retention by 10%
Assumption: Adding live chat during onboarding will help achieve that outcome
Output: A lightweight live chat prototype integrated into onboarding flow
Validation: Run the experiment and observe whether retention improves
If the retention rate doesn’t improve, the assumption may be wrong. You discard the assumption, not the outcome. You then move on to test the next best assumption. However, if multiple well-informed experiments fail to move the needle, you might revisit the outcome itself—perhaps it’s not realistic, not aligned with actual user needs, or not as valuable as expected.
Element
Definition
Live Chat Example
Assumption
A belief about how to achieve a desired outcome
Adding live chat during onboarding will improve 30-day retention
Output
A prototype, experiment, spike, or minimal implementation (e.g., MVP) used to validate the assumption
Lightweight live chat feature deployed to onboarding flow
Outcome
The measurable result you are aiming to achieve
10% increase in 30-day retention
Value
The benefit realized if the outcome is achieved and sustained
Higher customer lifetime value, improved ROI
Humanitarian Aid ExampleLet’s revisit the distinction one more time with a humanitarian example:
Imagine a public health initiative to combat malaria.
• Output: 1,000,000 malaria vaccines are delivered to the port in an affected country.
• Outcome: Vaccines are administered, leading to a 50% reduction in malaria infections.
• Value: Healthier population, reduced mortality, stronger local economy.
Concept
Definition
Malaria Vaccine Example
Output
What is produced or delivered
1,000,000 vaccines shipped to port
Outcome
What changed as a result of the output
50% reduction in malaria infections after vaccination
Value
The benefit derived from the outcome
Improved public health, reduced mortality, stronger economy
A Note on Value in Lean vs. Outcome Flow MappingIn Lean, value is strictly defined from the perspective of the end customer—any activity that doesn’t directly add value to the customer is considered waste. Value Stream Mapping in Lean focuses on identifying and eliminating those non-value-adding steps.
In Outcome Flow Mapping, we adopt a broader lens. While customer outcomes remain important, we recognize that businesses define very specific outcomes that deliver value to potentially many different constituencies (e.g., customers, shareholders, society as a whole). These benefits may not always be visible to the end customer but are critical to sustaining the business and guiding strategy.
By making outcomes the focal point, we shift the focus to delivering on outcomes/goals/objectives while allowing “value” to take on a broader, more encompassing scope than just “performing value-adding activities.”
To be clear, like Lean and traditional value stream mapping, Outcome Flow Mapping is absolutely concerned with identifying and eliminating waste from the flow of work. Whether you call the process Value Stream Mapping or Outcome Flow Mapping, waste is still a killer of good flow!
Benefits of Outcome Flow MappingOutcome Flow Mapping delivers several important benefits that go beyond simply drawing flow diagrams:
It centers outcomes as the anchor for alignment and learning.
By focusing on measurable outcomes—rather than just activities or deliverables—teams clarify what they are trying to achieve and how progress will be assessed.
It broadens and clarifies the concept of value.
In Lean, value is defined strictly from the customer’s perspective. In Outcome Flow Mapping, value can include benefits to multiple constituencies (e.g., customers, shareholders, teams, society). This broader framing encourages thoughtful discussion about why an outcome matters and to whom—making value explicit, rather than assumed.
It links work to strategic intent.
Outcome Flow Mapping connects day-to-day activities to broader organizational goals by mapping the flow of work to intended outcomes and then to the forms of value they are expected to deliver. This helps ensure effort is aligned with purpose and impact.
It supports multi-stakeholder dialogue.
Because value may look different to different groups, Outcome Flow Mapping provides a shared language and structure for engaging executives, customers, team members, and regulators in meaningful conversations about success.
It creates a natural feedback loop.
If outcomes are achieved but value does not follow, Outcome Flow Mapping helps teams trace backward—through assumptions, flows, and decisions—to uncover what needs to change.
It supports hypothesis-driven improvement.
By articulating assumptions about how outcomes generate value (e.g., “If we improve onboarding, customer retention will increase”), teams can test, validate, and refine their thinking. This injects scientific rigor into strategic execution.
It helps eliminate waste.
Staying true to its Lean roots, Outcome Flow Mapping remains focused on surfacing bottlenecks, handoffs, and steps that do not meaningfully contribute to delivering outcomes. Waste is still the enemy of flow—regardless of what you call the process.
ConclusionThe distinction between output, outcomes, and value matters. In many organizations, we celebrate outputs (feature launched, code shipped, campaign released) without asking whether they produced the desired outcomes. And even when outcomes are achieved, we rarely ask: did this create the value we expected?
Outcome Flow Mapping brings that clarity. It surfaces the actual path work takes to reach outcomes, and whether our structure, process, and decision-making support fast learning and effective delivery.
If your organization is already comfortable with the term value stream mapping and it’s helping you achieve better outcomes and deliver value—keep using it. There’s no need to change what’s working.
But if the term causes confusion—or doesn’t fit how your organization thinks about flow, experimentation, or structure—consider adopting Outcome Flow Mapping. Personally, I will be defaulting to the use of Outcome Flow Mapping, but will use Value Stream Mapping in contexts where that term already has an established presence.
In a future article, we’ll focus on how to use Outcome Flow Mapping as a practical tool to analyze and improve flow across teams and systems.
Want to Learn More About Outcome flow Mapping?If you want to learn more about Outcome Flow Mapping, reach out for a discussion.
April 20, 2025
How Value Streams Help You See and Improve Flow
You can’t improve what you can’t see.
This is the fourth article in our series, From Busy to Flowing, which explores how to unlock sustainable agility by improving how work flows through your organization—not just how busy your teams are.
So far, we’ve:
Reframed the productivity conversation by showing why flow beats busy Introduced core flow metrics to help you measure and improve how work moves through your system Diagnosed the organizational drag of dependency friction, which creates hidden delays, handoffs, and riskNow we turn to a foundational capability:
How do you understand where and how flow happens in your organization?
The answer: value streams.
But before we get there, we need to answer a deeper question.
What Flows Through Your Organization?We talk a lot about improving flow, but here’s the question too many organizations skip:
Flow of what?
Before you can improve flow, you must define the unit of flow—the thing that moves through your system and ultimately delivers value.
Your unit of flow might be:
A customer order A loan application A help desk ticket A product enhancement request A compliance review A co-branded credit card launchEach of these represents a business-relevant outcome. It’s the thing you’re trying to deliver—not just a task or artifact, but a result that matters.
The mistake many organizations make is focusing on task flow instead of outcome flow. Teams get faster at building things that don’t move the needle, because they’re tracking and optimizing the wrong unit of flow.
What Is a Value Stream?If the unit of flow is what moves, the value stream is where it moves.
A value stream is the end-to-end path that a unit of flow follows through your organization—from the moment a need arises to the moment a valuable outcome is delivered.
Let’s be more specific. This article focuses on what we call a Business Outcome Value Stream.
A Business Outcome Value Stream is the cross-functional flow of activities that transforms a customer or stakeholder need into a meaningful business result.
Examples include:
Processing a loan application Fulfilling an online order Resolving a customer support request Onboarding a new client Issuing a new co-branded credit card with an airline partnerThese flows typically cut across departments, teams, and systems. And they often contain hidden delays, handoffs, approvals, rework, and bottlenecks—none of which are obvious when you look at work one team at a time.
Value streams don’t exist on org charts. They exist in reality.
Mapping them makes that reality visible.
Why Value Streams MatterValue streams give you a systems-level lens. They allow you to shift from asking, “Are teams productive?” to asking, “Is value flowing?”
Here’s why they matter:
✅ They make delay visible
Most work spends more time waiting than being worked on. Value streams expose this hidden time.
✅ They span silos
Teams often optimize for local efficiency. Value streams help you optimize globally, across the full delivery system.
✅ They surface coordination costs
From unclear ownership to misaligned backlogs, value streams show where coordination friction slows everything down.
✅ They link action to outcome
They shift your metrics from effort (e.g. story points completed) to outcome (e.g. customer value delivered).
How to Interpret a Value StreamYou don’t need to map every detail to benefit from value stream thinking. Even a high-level sketch of your key value streams can offer critical insights.
Look for signals of flow friction, such as:
Work piling up between steps Excessive handoffs or unclear responsibility Long wait times for review or approval Loops of rework or context-switching Fragmented tooling or disconnected dataThese are signs that the system—not the team—is the constraint.
A well-understood value stream gives you leverage. It shows you where to focus improvement—not based on guesswork, but grounded in how your system actually behaves.
Value Stream Thinking Is an Act of Organizational Self-AwarenessMapping a value stream isn’t just a Lean technique. It’s a way to make your organization self-aware—to see how it truly delivers value.
When you look at your work through a value stream lens, you start to:
• Connect planning with execution • Align teams around shared outcomes • Reduce time to value • Identify system-level constraints that agile teams alone can’t fixIt’s not about process compliance. It’s about seeing the work behind the work.
Final Thought: See the Flow to Improve the FlowMost organizations are blind to how work actually flows. They measure team activity instead of business outcomes. They optimize pieces without understanding the whole.
Value streams give you that whole-picture view.
Value streams help you shift from delivering outputs to delivering outcomes—from busy to flowing.
And once you can see the flow, you can finally start to change it.
What to Create and Analyze Your Value Streams?Ready to understand how value flows through your organization?
We help teams map, interpret, and improve their value streams to unlock faster, more sustainable outcomes.
Get in touch to run a collaborative value stream session with your team.
April 13, 2025
Dependency Friction: The Systemic Drag You’re Not Measuring
 This article is the third in the From Busy to Flow series, which explores what it takes to unlock sustainable agility by improving the flow of work. In the previous article, we examined key metrics for measuring flow across an organization. This post builds on that foundation by focusing on one of the most critical and often hidden dimensions of flow, what I am calling, Dependency Friction. By understanding how dependencies impede flow—and learning how to quantify that friction—organizations can make more informed decisions about where to invest in improvement.
Agile organizations strive for flow—the smooth, steady movement of work through a process to ensure that good economic value is delivered. Achieving flow means avoiding idle or blocked work in economically sensible ways.
Yet across many organizations, flow remains elusive—not because individual teams are failing, but because the broader system is entangled in dependencies. A dependency is a relationship between two or more activities or resources that requires a level of coordination to achieve desired flow.
Dependencies are everywhere—between teams, platforms, governance bodies, shared services, and even policy layers. These are all forms of shared dependencies: dependencies where the work required to satisfy the dependency spans across teams or organizational boundaries. When these shared dependencies accumulate, they introduce Dependency Friction: a systemic drag on the organization’s ability to deliver value predictably, sustainably, and efficiently.
What Is Dependency Friction?Dependency Friction is the organizational tax created by the waiting, coordination overhead, rework, and delivery risk associated with managing dependencies across the system.
It’s not limited to blocked work—although blockers are part of the picture. A blocker is something that actively impedes the flow of work. Work must be in a blocked state to classify something as a blocker.
All dependencies are potential blockers—they carry the risk of impeding flow if coordination fails. A dependency becomes a blocker when it actively prevents work from progressing. Importantly, not all dependencies become blockers—but all blockers are the result of a failed or delayed coordination of a dependency.
Even when work isn’t fully blocked, dependencies can still degrade flow through uncertainty, delays, or coordination overhead. Recognizing this distinction is essential to understanding the full impact of Dependency Friction across a system.
This friction:
Reduces flow efficiency, increasing the time work spends waiting rather than progressing. Introduces delivery risk due to misaligned schedules and misunderstood constraints. Forces teams into coordination patterns that reduce autonomy and increase context switching.Organizations with high Dependency Friction often experience declining morale, slower time-to-market, and brittle plans that fall apart when reality diverges from expected sequencing.
Why You Must Measure It SystemicallyDependency Friction is not a local team problem—it is a systems-level condition. Even if individual teams are operating with agility, the surrounding structure may constrain them with structural dependencies—interdependencies that are embedded in the way the organization is designed, funded, or governed.
If leaders focus only on local velocity, team capacity, or individual productivity, they miss the real source of drag. What needs to be visible is how shared dependencies between parts of the organization inhibit overall flow.
That’s why measuring Dependency Friction is critical: it shifts attention from blaming teams to understanding and improving the system.
Creating a Dependency Friction MetricIt’s not clear that there is—or even should be—a universal formula for measuring dependency friction. In my work with clients, we define a custom Dependency Friction Metric by assembling measurable indicators that reflect their unique structure, delivery model, and flow goals.
What I present here is a work in progress. I expect my thinking to evolve as I and my clients continue to discover better ways to measure dependency friction and use that data to make value-added improvements to flow.
How to Use These IndicatorsEach of the following indicators can be measured in multiple ways—ranging from simple counts to more advanced time- or effort-based calculations. You don’t need to implement them all at once. Start with what your tools and teams can support, and refine over time. The goal isn’t precision—it’s visibility. These indicators are meant to shine a light on where dependency friction is impeding flow so you can investigate and adapt your system accordingly.
1. Blocked Time RatioMeasure the percentage of total Flow Time that a work item is in an explicitly blocked state due to a dependency—where work cannot proceed until the dependency is resolved.
This indicator draws a clear line between normal coordination lead time and actual friction that impedes flow. Not all waiting is blocking: if a team plans around a known lead time (e.g., expecting another team to deliver in five days), that’s coordination. But if the dependency fails or arrives late—causing progress to halt—then the work enters a blocked state.
Formula:
Blocked Time Ratio = (Time Work Was Actively Blocked by a Dependency / Total Flow Time) × 100
Why it matters: High blocked time is a signal of failed or delayed coordination. Not all dependencies become blockers—but when they do, they have an outsized impact on flow.
Systemic insight: Tracking blocked time due to dependencies reveals where the delivery system is most sensitive to coordination failure—and where friction is impeding progress.
Systemic connection: Variability in blocked time contributes directly to Flow Time Variability (another indicator defined below). If some items are blocked unpredictably while others are not, the result is a highly inconsistent delivery experience—even for similar types of work.
2. Dependency DensityCount the number of distinct teams, systems, or resources that must coordinate to complete a work item. This number is the dependency density of that work item.
Since different work items have different coordination needs, there is no single system-wide dependency density. Instead, you can summarize the metric across a portfolio or timeframe using:
Average Dependency Density Weighted Average (e.g., by story points or business value) Probability Distribution (e.g., % of work items that require 2, 3, 4 teams)This allows leaders to ask not “what’s our dependency density?” but rather “how often does our work require cross-team coordination—and how extreme is it when it does?”
Why it matters: More dependencies mean more coordination effort, risk, and time in flow.
Systemic insight: Frequent high-density work patterns suggest deeper structural issues: coupled architecture, cross-cutting responsibilities, or centralized functions that bottleneck delivery.
3. Coordination LoadCoordination Load measures the total time, effort, and distraction caused by the need to coordinate with other teams, systems, or governance layers in order to complete work. This includes both planned and unplanned coordination.
Planned coordination is the known overhead of managing dependencies. For example, if your organization performs scheduled dependency-coordination events (e.g., PI Planning in SAFe), a significant coordination load is baked into your process.
Unplanned coordination is additional—and often more disruptive—friction that comes from unscheduled meetings, clarifications, escalations, or ad hoc decision-making needed to move work forward.
Measurement Options:
Time Spent in Coordination – Includes both scheduled meetings and unscheduled syncs (as reported or estimated) Interrupt Frequency – Track how often teams are pulled into unexpected coordination (e.g., “We needed 3 extra meetings to resolve this integration”) Messaging or Comment Volume – Use tool activity as a proxy for coordination density (e.g., Jira comments across teams, Slack pings) Survey-Based Perception – Ask teams: “How much coordination effort did this work require?” or “Which dependencies were most burdensome to coordinate?”Why it matters:
Coordination load consumes time and attention that could otherwise be spent delivering value. Planned coordination may be necessary in complex environments, but unplanned coordination is costly and disruptive. Both represent a form of waste—waste that can often be reduced by decreasing the number or intensity of dependencies in the system. Measuring coordination load reveals just how much effort is being spent not on doing the work, but on managing the interdependencies required to get it done.
Systemic Insight:
High coordination load isn’t a failure of discipline—it’s a signal that the system requires excessive effort to align. It often stems from brittle interfaces, poor separation of concerns, or organizational structures that push complexity onto teams. Instead of asking teams to coordinate better, ask: Why is so much coordination required in the first place?
4. Rework Due to Dependency MisalignmentRework is an often overlooked effect of Dependency Friction. It occurs when completed work must be revised or redone due to unmet or shifting assumptions across a dependency. Dependencies increase the likelihood that assumptions will diverge, timelines won’t align, or constraints will change midstream. Whether it’s mismatched APIs, late-breaking policy changes, or evolving upstream inputs, the more dependencies in the system, the greater the likelihood that rework will be required to accommodate them.
Measurement Options:
Rework Count – Number of rework events or reopened work items Rework Rate – Formula: (Items Reworked Due to Dependencies / Total Completed Items) × 100 Unit: PercentageRework Effort –
Use tags, workflow status changes, linked tasks, or retrospective flags to help teams identify when rework was required due to a dependency problem—not just general revisions.
Why it matters: Rework not only delays delivery and demoralizes teams—it’s often a hidden cost of Dependency Friction that gets normalized or absorbed silently.
Systemic insight: Persistent rework reveals deeper misalignment in shared ownership, interface definitions, or coordination rhythms across teams. If rework is frequently driven by recurring dependency failure, it’s a signal that upstream structural change may be needed.
5. Flow Time VariabilityAnalyze the variability in Flow Time—the total elapsed time from when a work item is committed (e.g., pulled into active development) to when it is delivered. Focus on similar types of work items, especially those involving different dependency profiles.
Measurement Options:
Standard Deviation of Flow Time Calculate how much variation exists across similar work items. Unit: Time (e.g., days)
Flow Time Range or Percentile Spread
Flow Time Variability by Dependency Profile
Why it matters: High variability in Flow Time reduces predictability, undermines stakeholder confidence, and drives teams to pad plans with buffers.
Systemic insight: Much of the variability isn’t due to team performance—it stems from how dependencies are managed. Teams with similar skills may still deliver inconsistently if their dependencies are unstable or misaligned.
Related signal: Flow Time Variability is often driven by inconsistent dependency coordination. Work items with unexpectedly high blocked time can disproportionately stretch delivery timelines, making it harder to forecast with confidence—even when teams are performing consistently.
6. Perceived Friction (Survey-Based)Ask teams to rate which dependencies most impacted their ability to deliver. This taps into the human experience of coordination cost.
Measurement Options:
Friction Score per Dependency (1–5 scale) Team Friction Footprint (average across dependencies) Trend Analysis and Perception OutliersTeams know where the pain is—even if tooling doesn’t show it. Use surveys periodically to reveal unseen friction.
Why it matters: Perceived friction reveals what quantitative metrics might miss.
Systemic insight: Persistent high-friction scores map to weak organizational interfaces or ill-defined ownership.
Crafting a Composite ScoreThese indicators can be weighted and combined into a Dependency Friction Score—not to enforce a universal formula, but to reflect what’s most meaningful and impactful to your organization’s flow. The score becomes a directional signal tailored to your structure, scale, and delivery model.
Options for Combining:
Normalized Weighted Average – Scale each indicator to a 0–100 range and assign relative weights based on what matters most to your flow goals. Friction Index by Area – Aggregate indicators by value stream, product, or delivery area to identify where dependency friction is most experienced. Radar or Heat Maps – Visualize friction patterns across teams, departments, or product lines to guide targeted improvements.The result is a single score that helps leaders visualize where dependency friction is most concentrated—whether by team, product area, or value stream. The goal isn’t to compare team performance, but to highlight systemic hotspots where coordination breakdowns, structural misalignments, or architectural bottlenecks are most likely to impede flow.
Friction should be attributed to the area experiencing the disruption to flow, not necessarily the area causing it. This creates a consistent and objective basis for comparison—highlighting where in the system work is being delayed or reworked the most. Once those hotspots are visible, you can investigate what’s driving the friction—whether it’s upstream teams, brittle architecture, unclear ownership, or something else entirely.
The score doesn’t need to be perfect—it’s a signal. Use it to track changes over time, guide conversations, and shift attention from team-level blame to system-level design opportunities.
From Invisible Drag to Visible MetricDependency Friction is real—and it’s systemic. If you’re not tracking it, you’re likely misdiagnosing delivery problems and optimizing the wrong things.
By building a metric that reflects where and how Dependency Friction occurs, you create a critical feedback loop—one that helps your organization evolve toward more resilient, decoupled, and flow-optimized systems.
Reducing Dependency FrictionThis article is about seeing the dependency-friction problem so you can measure it meaningfully. This article does not provide solutions to reduce dependencies or improve flow. For that, see:
Shared Dependencies: The Critical Issue When Adopting Agile at Scale The Economic Consequences of Dependencies Agile Organizations Must Address Both Structural and Instantiated Dependencies Dependencies Are Killing Your Agile Flow at ScaleIf you are interested in training on this topic, check out my class focused on how to reduce dependencies and improve flow called:
Dependencies Are Killing Your Agility: Learn to Fight Back!
Or, if you want tailored support, let's start a conversation!
April 7, 2025
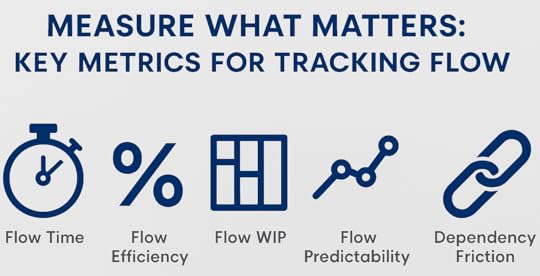
Measuring What Matters: Key Metrics for Tracking Flow
This is the second article in our 10-article series: From Busy to Flowing – Unlocking Sustainable Agility. In the first article, we challenged the idea that keeping people busy leads to better results. Now, we turn to a fundamental question for any team or leader serious about improvement:
How do you know if your system is truly flowing—or just staying busy?
Improving flow efficiency means optimizing how work moves through your system, from idea to impact. But you can’t improve what you don’t measure. Let’s explore the flow metrics that matter most, so you can make data-informed decisions that lead to faster, smoother, and more predictable delivery.
Why Traditional Metrics Miss the MarkMost organizations measure activity: tasks completed, hours logged, or individual utilization. These numbers may look good, but they rarely point out where value-delivery delays occur.
To understand and improve flow, you need metrics that shine a light on how value actually moves through your system. Not just how busy your people are, but how well your system delivers outcomes.
The Flow Metrics That MatterHere are the five key metrics that will help you expose delays, spot improvement opportunities, and manage your delivery system more effectively.
1. Flow Time (a.k.a. Cycle Time)What it is:
The total time a work item takes from the point of commitment to delivery—when a team agrees to start the work through to when it’s completed.
Why it matters:
Flow Time tells you how quickly your system delivers value once work has begun. It includes both active working time and waiting time (e.g., queues, blockers, and delays). You’ll often find that Flow Time is heavily influenced not by the work itself, but by shared dependencies that slow progress between teams and systems.
We’ll explore the systemic effects of shared dependencies and how they distort Flow Time in the next article.
Clarifying note:
Flow Time does not include the time a work item spends in a pre-commitment state, when it exists as an option under consideration (e.g., in a backlog, idea pool, or discovery stage). If understanding that option-state duration is important for your organization, you may wish to track it separately as Option Time or include it in Lead Time, which spans from idea to delivery.
Tracking both Flow Time and Option Time can give you a more holistic view of how ideas flow through your system—from proposal to completion.
2. Flow Efficiency %What it is:
The percentage of Flow Time that a work item is actively being worked on versus waiting in queues, blocked, or idle.
Formula:
Active Time ÷ Flow Time × 100
Why it matters:
Most systems have low flow efficiency (e.g., 10% or less). This metric helps teams identify waste and reduce idle time. Dependencies—especially unmanaged or poorly coordinated ones—are a major source of hidden inefficiency.
3. Flow WIP (Work in Progress)What it is:
The number of work items currently in progress—started but not yet completed.
Why it matters:
High WIP increases context switching, reduces focus, and slows down flow. It’s one of the biggest drivers of delays and unpredictability. Reducing WIP doesn’t increase team capacity—it improves how well existing capacity is utilized by minimizing waste, context switching, and delays—allowing teams to deliver more value with the same resources.
4. Flow PredictabilityWhat it is:
The consistency and reliability of your Flow Time—how often you deliver work within expected timeframes.
Why it matters:
Stakeholders don’t just want fast delivery—they want delivery they can count on. Flow Predictability answers the question: Can we trust our delivery system?
Consistency refers to how much variation exists in your Flow Time. A consistent system delivers work items in a narrow, predictable range (e.g., most stories complete in 6–8 days). Reliability refers to how often you meet your forecasted or promised delivery timeframe. Even if your Flow Time varies, you can still be reliable if your forecasts consistently account for that variation.The most effective teams are both consistent and reliable: they understand their delivery patterns and communicate realistic expectations—building trust across the organization.
Inconsistent Flow Time is often caused by inconsistent coordination with shared dependencies—something we’ll explore in depth in the next article.
5. Dependency Friction (Preview of the Next Article in the Series)What it is:
A systemic source of drag in modern delivery systems. Dependency Friction reflects the organizational tax created by the effort, waiting, coordination, and risk associated with managing shared dependencies—the handoffs, approvals, or team-to-team dependencies that span organizational boundaries.
Why it matters:
Even when teams perform well individually, work often gets stuck waiting on others. Shared dependencies increase unpredictability, coordination overhead, and rework. And unlike local blockers, this type of friction is systemic—invisible in traditional tooling but deeply embedded in how the organization is structured.
In our next article, we’ll show you how to quantify Dependency Friction using a set of system-level metrics—and why it may be the biggest hidden cost in your value stream.
Making Flow Metrics ActionableTo get the most value from these metrics:
Visualize your work: Make queues, wait states, and WIP visible on boards and dashboards. Track trends: Use flow data to guide continuous improvement, not micromanagement. Act on insights: Limit WIP, eliminate blockers, and streamline handoffs. Use metrics for learning, not blaming: Flow metrics are about system health, not individual performance.Flow Metrics Drive Better Business OutcomesWhen you measure flow—not just effort—you enable:
Faster delivery More reliable planning Less waste and rework More engaged teams Happier customersFlow isn’t about going faster. It’s about going smoother—with less friction, more clarity, and better results.
Up Next in the Series:Flow isn’t just a technical metric—it’s a competitive advantage!
The Hidden Drag on Flow: Measuring and Reducing Dependency Friction
We’ll explore how to define and quantify Dependency Friction, understand how shared dependencies distort flow metrics, and introduce a set of building blocks you can use to create your own Dependency Friction score.
Ready to Start Tracking What Really Matters?
If your teams are tracking tasks but not flow, you may be missing the signals that reveal where your system is truly stuck.
Whether you’re new to flow metrics or ready to refine your measurement approach, I can help you identify the right signals, visualize your delivery system, and start making sustainable improvements.
Let’s talk about how to measure what matters—so your work can flow.
Contact us to learn more about private training or schedule a consultation.
April 1, 2025
From Busy to Effective: Why Resource Efficiency Is Killing Your Throughput

This is the first article in our 10-week series: From Busy to Flowing – Unlocking Sustainable Agility. In last week’s kickoff, Why Flow Efficiency Matters More Than Ever in an Era of Cost Cutting, we explored why focusing on flow is essential in today’s cost-conscious environment. Now, we begin the series in earnest by challenging one of the most deeply ingrained (and damaging) assumptions in modern work: the belief that keeping people busy drives productivity. In reality, it may be the very thing holding you back.
Most organizations pride themselves on being busy. Calendars are packed, meetings are stacked, and dashboards glow with activity. But there’s a critical distinction between being busy and being effective—and in today’s volatile business climate, that distinction can make or break your ability to compete.
At the heart of this challenge lies a fundamental misconception: the belief that maximizing resource efficiency—keeping every person as busy as possible—is the key to productivity.
In reality, it’s killing your throughput.
The Resource Efficiency TrapResource efficiency is the idea that we should maximize the utilization of each person or resource in the system. It’s a seductive concept—after all, idle time feels like waste, and full calendars feel like progress.
But here’s the problem: work doesn’t flow through organizations the way we think it does. Most work is interdependent, requiring input, coordination, and sequencing. When everyone is fully utilized, there’s no slack in the system to absorb variability. That means even small delays ripple through the organization, multiplying wait times and creating bottlenecks.
Imagine trying to drive through a city where every road is at 100% capacity. The slightest disruption—an accident, a red light, a wrong turn—triggers gridlock. The same thing happens in your teams.
Busy ≠ ProductiveHere’s what you get when you optimize for resource efficiency:
Longer cycle times: Work waits in queues because everyone is already overloaded. More context switching: People juggle too many projects at once, reducing focus and increasing cognitive load. Delayed feedback: Long queues mean slower learning, slower response to change, and higher risk of rework. Hidden bottlenecks: Because everyone is “busy,” no one sees the real constraints in the system. Burnout: Teams feel overwhelmed, and morale drops—even when no real progress is being made.It’s not a people problem. It’s a systems problem.
The Alternative: Flow EfficiencyInstead of asking, “Is everyone busy?” ask, “Is work flowing?”
Flow efficiency shifts the focus from maximizing utilization to maximizing the movement of value. It’s about reducing the time it takes for work to go from idea to delivery, from investment to impact.
This means:
Limiting work in progress Reducing handoffs and delays Fixing dependencies that block flow Empowering teams to make local decisions Delivering in smaller, faster incrementsIn a flow-efficient system, you may see “idle” moments—but those moments create resilience, adaptability, and speed. Think of them as white space between musical notes: without them, there’s no rhythm—just noise.
Real Productivity Comes from FlowWhen organizations shift from resource efficiency to flow efficiency, they unlock:
Faster delivery of value to customers Greater adaptability to change More sustainable pace for teams Better alignment between business goals and daily workIt’s not about working harder or faster—it’s about working smarter by designing systems that optimize for throughput, not activity.
Are You Caught in the Busyness Trap?Take a look at your organization. Are people constantly multitasking? Are priorities stacking up instead of moving forward? Are handoffs and approvals slowing everything down?
If so, your problem isn’t a lack of effort—it’s a system that’s optimized for busyness instead of flow.
It’s time to stop asking how busy your people are and start asking how effectively work moves through your organization.
Ready to Break Free from the Busyness Trap?If your teams are always busy but nothing seems to move, it’s time to shift your focus from keeping people occupied to enabling real progress.
Whether you’re just beginning to explore flow efficiency or already mapping your value streams, I can help you identify where your system is slowing down—and how to fix it.
Let’s talk about how to make your work flow. Schedule a consultation or learn more about private training sessions for your team.
March 28, 2025
Why Flow Efficiency Matters More Than Ever in an Era of Cost Cutting

This article serves as the kickoff to our upcoming 10-week series: From Busy to Flowing – Unlocking Sustainable Agility. In the weeks ahead, we’ll dive deep into the practical strategies and system-level thinking organizations can use to improve flow efficiency—moving from overloaded, reactive teams to streamlined, value-driven delivery.
Before we begin the series, this preview sets the stage by exploring why flow efficiency matters so much right now—and how it offers a more sustainable path through economic constraint, change, and complexity.
In today’s turbulent business climate, companies across industries are facing economic pressures that drive cost-cutting measures, hiring freezes, and workforce reductions. Organizations must find ways to do more with less while maintaining competitive advantage. Traditional cost-cutting approaches often target headcount reductions and budget constraints, but these strategies alone can erode long-term business value. Instead, organizations should focus on flow efficiency—optimizing the movement of work through a system to maximize value delivery while minimizing waste.
Understanding Flow EfficiencyFlow efficiency measures the proportion of time work is actively progressing toward completion versus waiting in queues, blocked by dependencies, or delayed by inefficiencies. Unlike resource efficiency, which focuses on keeping employees busy, flow efficiency prioritizes getting value to customers as quickly and predictably as possible. High-flow organizations reduce bottlenecks, eliminate unnecessary handoffs, and ensure that critical work moves smoothly through their systems.
The Cost of Low Flow EfficiencyMany organizations, even those with high-skilled teams, suffer from inefficient workflows that introduce unnecessary delays. Common culprits include:
Excessive work in progress (WIP): Too many parallel initiatives dilute focus and stretch teams thin. Bottlenecks and dependencies: Delays arise when teams must wait for approvals, cross-functional handoffs, or constrained resources. Batching work: Large releases and infrequent deployments increase cycle times and limit feedback loops. Misaligned incentives: Optimizing for local efficiency (e.g., individual or team productivity) rather than end-to-end value creation leads to siloed operations and poor coordination.With economic uncertainty upon us, the hidden costs of these inefficiencies become more pronounced. A company that optimizes for flow efficiency can increase speed to market, enhance responsiveness, and improve resilience—all without increasing costs or workloads.
Why Flow Efficiency Matters More in a Downturn Faster Delivery, Higher ROI – By reducing delays, companies can deliver value faster, shortening the time between investment and return. This becomes crucial when budgets are constrained, and every dollar spent must yield tangible results. Reduced Waste, Smarter Cost Savings – Instead of arbitrary budget cuts, organizations can identify wasteful processes and streamline workflows to maintain productivity while lowering costs. Improved Employee Engagement – Layoffs and hiring freezes often create higher workloads for remaining employees. A focus on flow efficiency prevents burnout by reducing unnecessary friction and ensuring that teams work on the most impactful tasks. Stronger Competitive Advantage – Organizations that optimize flow efficiency can respond faster to market changes, capitalize on emerging opportunities, and sustain innovation even in difficult times.Practical Steps to Improve Flow EfficiencyTo transition from resource efficiency to flow efficiency, organizations should consider:
Mapping Value Streams: Identify and analyze the steps involved in delivering value to customers, uncovering delays and inefficiencies. Limiting Work in Progress (WIP): Reducing the number of active tasks prevents context switching and accelerates delivery. Decentralizing Decision-Making: Empower teams to resolve issues without unnecessary approvals to keep work flowing smoothly. Automating Repetitive Tasks: Leverage technology to eliminate manual bottlenecks and reduce wait times. Focusing on Small, Frequent Deliveries: Shift from large, infrequent releases to smaller, continuous value delivery cycles.Flow Efficiency: The Key to Thriving in Uncertain TimesAs companies navigate cost pressures and economic challenges, those that optimize for flow efficiency will emerge stronger. The ability to deliver value quickly, efficiently, and sustainably will separate thriving businesses from those struggling to adapt. Organizations that shift their focus from mere cost-cutting to operational agility and workflow optimization will not only survive but lead in the next phase of economic growth.
Now is the time to rethink how work flows through your organization. Are you maximizing value delivery, or are inefficiencies holding you back? By embracing flow efficiency, businesses can achieve sustainable cost reductions while maintaining the speed and adaptability necessary for long-term success.
Please reach out if you’re interested in speaking with me about how to improve your organization’s flow efficiency
January 23, 2022
Can a Scrum Team Handle Both Plan-Driven and Interrupt-Driven Work?
In every Scrum class I get asked how to deal with interrupt-driven work. Scrum is very effective when dealing with planned work, but what about unplanned work that appears during a sprint? Can we use Scrum to deal with both plan-driven and interrupt-driven work? Yes, if there is statistical predictability to the must-do-now interrupt-driven flow stream. Let’s dissect what that means and how to apply it.
Flow StreamsImagine there are two streams of work, each with different flow characteristics. There is the plan-driven flow stream and the interrupt-driven flow stream.
The plan-driven flow stream is the one most typically associated with Scrum and is captured in the product backlog. The order of the items in the backlog represents the “plan” for how the work should unfold. The Scrum team plans to work on the items at the top of the backlog before the items further down in the backlog. When the Scrum team performs sprint planning, it’s determining a plan for the next sprint. Scrum therefore naturally aligns with a plan-driven flow of work.
As the Scrum team learns into the problem and the solution, work on a plan-driven stream can change. However, those changes are handled by standard product backlog refinement (grooming) and therefore are included in the plan-driven stream. Importantly, these types of changes don’t interrupt the work of the current sprint.
The interrupt-driven flow stream captures unplanned work that appears during a sprint. For example, an important defect is reported, or a system outage occurs, etc. If the Scrum team chooses to immediately address the unplanned work, it will interrupt the plan-driven work of the current sprint.
Default Scrum Approach: Don’t Interrupt the Current SprintOrganizations are interested in whether a plan-driven flow stream and an interrupt-driven flow stream can be provided to the same Scrum team. Scrum has a default answer to this question: yes!
Scrum has a rule: “No goal-altering changes once a sprint starts.” Basically, once the sprint goal has been established and sprint execution has begun, no change is permitted that can materially affect the sprint goal.
Based on this rule, we don’t interrupt the planned work of the sprint. Instead, we create a new product backlog item for the unplanned work and insert it in the product backlog in the correct priority order so it will get planned into a subsequent sprint. The default Scrum approach is to treat unplanned work the same as planned work. We just merge the two streams of work into the same product backlog.
I know what you're thinking. What if the Scrum team can’t defer the unplanned work until a future sprint because the work is urgent?
Urgency: Must-Do-Now vs. Would-Like-To-Do-NowLet’s use an example. Assume today is Black Friday and our primary ecommerce system has just gone down, and the company is losing a million dollars a minute in sales. Is it economically sensible for the Scrum team to say, “Just create a new product backlog item for that system outage and we’ll address it in the next sprint?”
Of course not! This type of interrupt cannot be ignored since it has a must-do-now cost of delay (CoD).
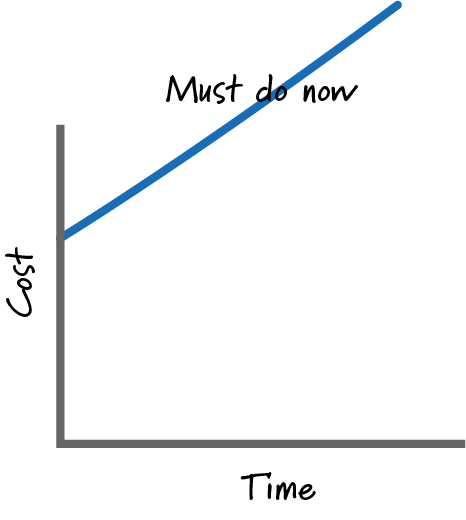
Any item with this type of cost of delay has an urgency that must be addressed immediately.
The Scrum rule of “No goal-altering changes once a sprint starts” is generally sensible since making changes during the current sprint is wasteful. However, we must act in an economically responsible way. In this example, the cost of not interrupting the planned work of the sprint is far more expensive than the waste of interrupting, so we will interrupt the planned work.
However, if the unplanned work is not of type “must-do-now,” but rather of type “would-like-to-do-now,” then the urgency of this work doesn’t justify interrupting the planned work of the sprint. Instead, the unplanned work should be inserted into the product backlog in the correct priority order as previously discussed and treated the same as planned work.
FrequencyThere is one last important factor to consider, the frequency of must-do-now unplanned work. Frequency of occurrence affects our approach to dealing with these items. If unplanned work is a rare occurrence, then just about any reasonable approach to dealing with it will work.
For example, imagine the Scrum team does two-week sprints and once a year (one out of 26 sprints) unplanned work appears and the team must decide to interrupt or not interrupt the planned work of the current sprint. In most organizations this just isn’t a big enough issue that we ought to be creating special processes to deal with it.
On the other hand, if urgent unplanned work is frequently interrupting sprints, then we do need a practical solution.
Create Two Teams and Split the Flow StreamsAssume that the frequency of must-do-now unplanned work is high enough to require a solution. There are two common solutions.
In the first solution, organizations will create two teams and split the flow streams.
A common example is when the plan-driven stream is provided to a Scrum team and the interrupt-driven stream is provided to a Kanban team.
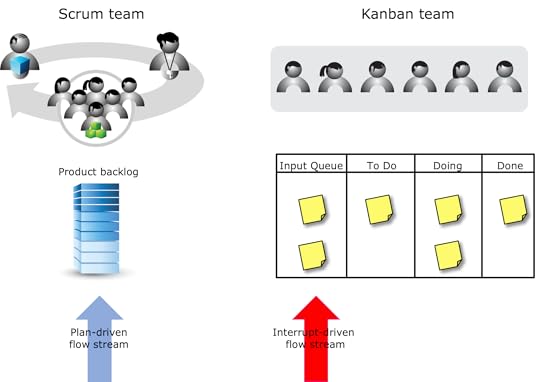
Organizations that adopt this approach have decided that the overall flow would be better if the two different flow streams went to different teams. In this case no one team must handle two streams with different flow characteristics.
There are, however, many valid reasons why organizations don’t want to create a separate team to handle the interrupt-driven stream (e.g., additional cost, skillset availability, etc.).
Provide Both Flow Streams to the Same TeamThe second solution is to provide the plan-driven flow stream and the interrupt-driven flow stream to the same Scrum team. This works when there is useful statistical predictability to the must-do-now interrupt-driven flow stream.

Here’s the “good” news. If your planned work is frequently getting interrupted with must-do-now items, then future interrupts are somewhat predictable based on the pattern of past interrupts. If your team captures its work items in an electronic tool, it should be able to collect the tickets of previous must-do-now interrupts and perform a statistical analysis of the associated data.
Let’s say the analysis indicates that, on average, the Scrum team spends about 30 hours of time each sprint working on unplanned, must-do-now interrupts. With this data, we could direct both the plan-driven stream and the interrupt-driven stream to the same Scrum team. That Scrum team would then buffer time during sprint planning to account for the predicted interrupt-driven work it will likely encounter during the sprint.
Exactly how much time to buffer depends on the results of the analysis and how confident the team wants to be that it has sufficient buffer to handle the unplanned work. Maybe the analysis shows that 30 hours would work 50% of the time (i.e., half the time the team would have more than 30 hours of unplanned work in a sprint). The analysis might also show that 45 hours would work 85% of the time. The team could choose the number of hours to buffer based on its desired confidence level.
Of course, if the historical data does not lead to any useful pattern, then this approach won’t work. For example, if we try to answer the question “How many hours should we buffer at the sprint planning meeting,” and the historical data is all over the place (e.g., you are just as likely to need zero hours as you are 500 hours), then the Scrum team would have no clear guidance on how to proceed. In this case the organization may choose to direct the flow streams to two different teams as I previously discussed.
SummaryCan the same Scrum team handle both plan-driven and interrupt-driven work? The default answer in Scrum is yes, and we merge both streams of work into the product backlog.
This default solution isn’t practical when dealing with unplanned work that has must-do-now cost of delay. However, if there is useful predictability to the must-do-now interrupts, we can reserve a capacity buffer during sprint planning to deal with the predicted interrupts we are likely to see.
If no such useful predictability exists, then we can't provide both flow streams to the same Scrum team. Some companies in this situation will choose to create a second (likely Kanban) team to handle the unplanned work.
January 16, 2022
5 Challenges Facing Self-Organizing Teams
Most organizations that employ agile ways of working, like Scrum, focus on self-organizing teams. In these organizations, operational decisions are delegated to teams, whose members have the most detailed knowledge of the consequences and practicalities associated with those decisions.
Self-organization is a bottom-up, emergent property of a team, so there is no external dominating force applying top-down command and control. In other words, management cannot just say to a team, “go forth and self-organize!” There are real challenges that organizations and teams face when attempting to self-organize. I will address the five most common that I see.
The Five ChallengesThe five most common challenges to self-organizing teams are:
Some people prefer to be told what to do Dominant personalities can overwhelm the team Some companies prefer a single authoritarian Understanding the boundaries Perception that it takes longer to make decisionsLet’s discuss each.
Some People Prefer to Be Told What to DoThere are people who, either by their nature, or through organizational conditioning, prefer or expect to be told what to do. They show up to work in the morning and their managers tell them what to work on that day.
You can imagine how it might be a bit unnerving for these people when they are now expected to work on a self-organizing team. When that change occurs and they ask their managers what to work on, they get told: “Go figure that out for yourself!” In my experience some people have a very difficult time making this transition.
Empathetic coaching can help people feel more comfortable making their own decisions. Also, seeing other team members absorb decision-making responsibility can help the more hesitant people overcome this challenge.
Dominant Personalities Can Overwhelm the TeamIt is difficult for teams to self-organize and make decisions in the presence of one or more dominant personalities. You have likely seen the person on the team who will assert his opinion right over the top of anyone else’s. This is the person whose actions will cause other team members to avoid engaging in useful discussions.
Teams will have a difficult time self-organizing in this situation. Sometimes coaching the dominant individual to be more of a team player will help. Other times we resort to having everyone express their opinions in writing before conversation begins. With the latter approach, more introverted team members get a chance to be heard. In the presence of disruptive dominant personalities, we need to take some form of action or self-organization will continue to be compromised.
Some Companies Prefer a Single AuthoritarianWe’ve all heard the expression that “If everyone is in charge, then no one is in charge.” I have worked with companies that believe one person should ultimately be in charge and therefore held accountable for the team’s results. This person might be a manager, a tech lead, or dare I say, a ScrumMaster. In such organizations it is virtually impossible for teams to self-organize.
Let’s take the ScrumMaster as an example. The ScrumMaster is supposed to be a servant leader who provides Scrum process leadership in service of the other team members. Imagine if we told the ScrumMaster of a team that she will be held fully accountable for the results of the team. The next time the team needs to make an important decision, what if the ScrumMaster doesn’t agree with that decision? We can imagine she might say something like: “Hey, it’s my neck that’s on the line, not yours. So, we’re going to do it my way.” I can’t imagine a better way of killing self-organization than having the ScrumMaster dictate decisions for the team.
This challenge needs to be addressed at a higher organizational level than the team.
Understanding BoundariesIn most organizations, managers decide on strategic work, and (usually) decide on which teams are needed and who will be on each team.
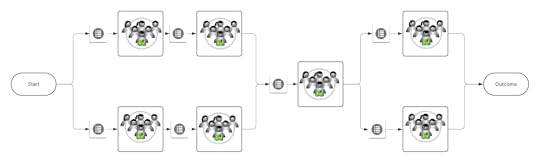
In the picture below, the managers define the sandboxes (products or projects) as well as who gets to play in each sandbox (the teams). The teams are supposed to self-organize inside their sandbox.
[image error]
A sandbox provides the boundaries in which a team is expected to self-organize. In the picture, the sandbox boundaries look sharp and obvious. In practice, they can be far less clear and that is the challenge. To be effective at self-organizing, each team needs clarity on what is in and out of scope for their decision making.
To overcome this issue, organizational leaders should make all such boundaries clear and be available to help provide additional clarity when edge situations arise. It is not just the team members who can struggle. Leaders may struggle to know how much autonomy to give their teams while feeling comfortable they are still driving the strategic direction.
Perception That It Takes Longer to Make DecisionsIn some organizations there is a perception that self-organizing teams will take longer to make decisions than more traditional teams with an empowered leader. This perception can be a significant impediment to setting up self-organizing teams.
I have worked with organizations that have the misguided belief that self-organization means that everyone must be involved with every decision. Of course, this need not be the case. Self-organizing teams will determine the most effective and efficient ways to make decisions. In my experience, when the person or people who have the best knowledge of the situation are empowered to act, they can be thoughtfully decisive (i.e., fast, and effective).
On the other hand, if all decisions must be vetted or finalized by even a very capable and experienced leader, then such a person can easily become the bottleneck. Furthermore, such a process would deny team members the opportunity to build and flex their own decision-making muscles.
When I find myself in a conversation about decision-making speed, sometimes a logical argument for why self-organizing teams will not suffer this problem is sufficient. Other times, we just need to run the experiment. Let’s not assume that decision-making speed will be better or worse, rather let’s see how well a self-organizing team performs and base our next actions on that data.
SummarySelf-organizing teams are a powerful unit for completing valuable work. There are challenges that must be overcome by organizations wishing to employ such teams.
In Scrum organizations, it is often the ScrumMaster who will assist with overcoming these issues. If you want to explore this topic deeper, as well as many other ScrumMaster-related topics, please consider attending an Innolution Certified ScrumMaster (CSM) Class.
What are your thoughts? Have you experienced challenges with establishing self-organizing teams? Leave your comments below.
If you are interested in learning when we publish new content, signup for our newsletter!