All About Those Stats
Back in 2009, I received a notebook for Christmas. Shocking, I know. I loved this notebook because it was petite and spiral bound and the paper was soooo smooth and the cover had fun colorful stripes and I would have put it with my collection of gorgeous, unused notebooks (all writers have them) except that I was suddenly struck with a brilliant idea: I would use this notebook to track every single book I read! Yes, I know Goodreads existed back then, but Goodreads couldn’t fit in my pocket or my book bag, now could it? (I had a Motorola Sidekick at the time, RIP phones with no internet connectivity.) A small notebook that I could take everywhere was clearly the superior solution and I began recording my reads with absolute glee.
Honestly, before 2009 it had never occurred to me to track all the books I read. I used to have a blog, and I’d talk about books there. Aside from that, I just…read a lot. How many books I finished in a week, month, or year didn’t really matter, but something had changed. Now I craved more. I wanted…data.
For nearly 8 years, I carried that little notebook with me everywhere and recorded the title of every book I ever finished and the date. And I didn’t lose it once! (Ask my spouse–they will tell you this defies belief. Just this week I’ve misplaced my Airpods, my phone, my keys, the bill I was going to pay, and my phone again.) I loved flipping through the soft pages and seeing that on this day three years earlier, I was reading this book or that series. I tallied up all the books I read each year and kept careful track on a page in the back of the notebook. I would spend a lot of time sorting this data by hand into various categories. I made my own pie charts by hand! It was so, so nerdy.
But alas, it was too good to last, for in 2017 I lost the notebook in a house fire. I won’t lie, in the immediate aftermath, there were times I wished I’d taken 3 seconds to grab the damn thing over anything else…and I didn’t even have time to grab my glasses, which says a lot. (As an aside, my spouse tells me that too many of my stories go in the direction of “and then my house burned down” and it can be jarring for my audience so I want to assure you that I am okay, it happened eight years ago and it sucked, but I make lots of jokes about it now.) Naturally, this loss was quite a blow in addition to all of the other things I was dealing with at the time. It felt like a lost a little artifact of my own identity, because in a way, all of those books that I read for a nearly 8-year time period had a huge impact on me. They were the books I read in college, in graduate school, and the books I read while querying and trying to sell my first novels. Those books shaped who I was, and tracking them was one way for me to visualize and understand my evolution as person and writer.
In the aftermath of the fire, it was clear that a new system must be put into place. And that was when I dragged unwillingly into the 21st century. A colleague at Book Riot shared a Google-sheets based spreadsheet for tracking reading and while it held none of the romanticism of a physical journal or notebook, it did have one major advantage: A spreadsheet saved in the cloud can’t be destroyed by fire! Or misplaced by an absent-minded reader! Or spilled on, or dropped in a puddle, or, or, or. So I started using it, and then I started tweaking it, and soon I was creating a similar spreadsheet from scratch and tweaking it to suit my reading lifestyle. For years, I shared the template on Book Riot, but since I’m not longer with the company, I thought I’d just share this year’s on my socials. And even though it’s, ahem, late January, I’m sharing it here as well in case you’re looking for a new way to track your reading that isn’t Goodreads or Storygraph.
Click here to access the log. You will need a Google account in order to use this. Click File –> Make a copy, and save it to your own Drive. This will get you access to the editable version. And behold, your new log!
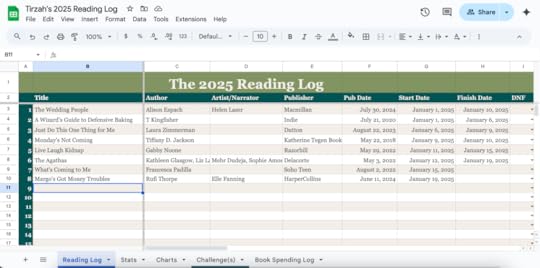
There are five elements to this reading log: the log, where all the data about each book is recorded, the stats tab, the charts tab, a challenges tab, and a book spending log. (I know, I went there.)
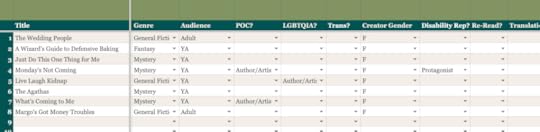
The above photo is the log tab, and as you can see from my sample, it’s where you input all of the data. The nice thing about this is you can fill out as little or as much as you want, but because I love stats, I track a lot. Not just start and finish date, but format, genre, audience, and diversity stats. I find that doing this is 1) interesting, and 2) helps me keep on track with goals to read diversely. This tab is also where I can add stars and notes–and I included half star ratings!
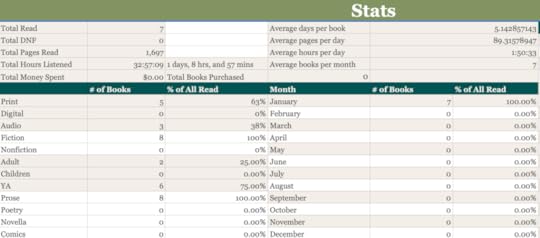
The second tab is where the stats appear. It’s a parade of numbers and percentages! This is where we see a lot of the big picture stats, as well as the numbers broken down into small categories. This stats tab makes me so happy…but what could be better than numbers?
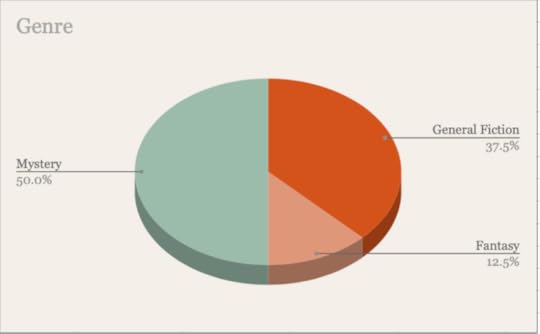
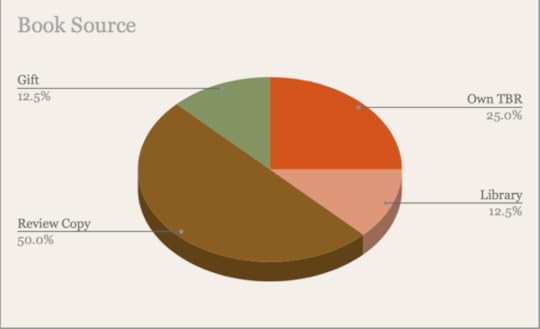
PIE CHARTS! These are just a few examples of the pie charts that this tab generates from the Stats tab. I’m a really visual person, so it’s fun to check in on these every time I finish a book.
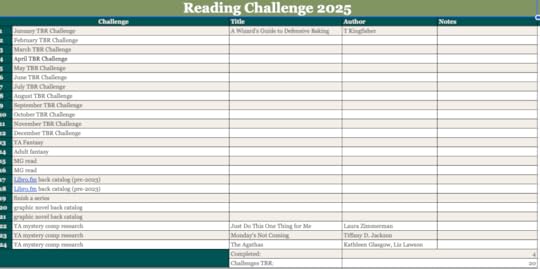
The Challenges tab is totally optional, but I find it fun to come up with various reading challenges each year. I write my own goals and challenges rather than following anything formal but you could input various internet challenges into this table to keep track of your progress. The challenges column is blank in the template, so you can fill it out or delete the tab if you’d prefer to just follow your heart. If you input the challenge number on the log page, the title automatically populates!
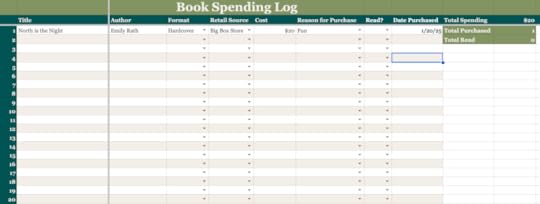
The final book spending log tab is also totally optional, but I like to track my purchases because I claim book purchases on my taxes (perks of being an author!) and also, it helps me stay on budget. Plus, one off my goals is to try and read all of the books I purchase (traditionally a challenge for me), so this helps me track that. You can track your retail source as well as the reason for purchase—maybe you are buying it for book club, maybe just for fun? Knowledge is power. Or just interesting.
The best part about all of this is that you can customize all of the drop down menus and options! Change up the genre, the reason for reading, the retail source–whatever you want. I created a Youtube tutorial to show you how to do just that!
If you take this for a spin, I really hope you enjoy it. Let me know if you like it, especially if you decide to tweak or customize–I’d love to hear how you make it your own!