Qvar, an online app to explore q-variance
The Qvar Shiny app is now live at:
https://david-systemsforecasting.shinyapps.io/qvar/
The app provides an interactive way to explore q-variance – a property that links price changes and volatility in a way not anticipated by traditional models. It draws on ideas from quantum probability to test whether a universal variance relationship holds across major stocks.

What Is Q-Variance?
In the q-variance framework, the expected variance of log returns x, corrected for drift, over a period T follows to good approximation the formula
V(z)=σ0^2+z^2/2
where z=x∕√T and σ0 is a minimum volatility parameter that is estimated from the data.
This formula implies that variance grows quadratically with the scaled price displacement z, in contrast to the linear time-dependence in classical models such as Black–Scholes. The app illustrates this property for 355 S&P 500 stocks that have been in the index for at least 75% of trading days between 1992-01-02 and 2025-04-17.
What You Can Do in the App
 Pick any of 355 S&P 500 stocks
 Choose time periods from 1 week to nearly a year
 Compare actual market behaviour to the q-variance prediction
 Download the raw data to analyse yourself
Why It’s Worth a Look
Reveals patterns hidden in noisy financial dataHelps test whether the quantum-inspired model matches realityUseful for researchers, students, and anyone curious about volatilityMinimum volatility + price-change effect = q-variance
How to Use the App
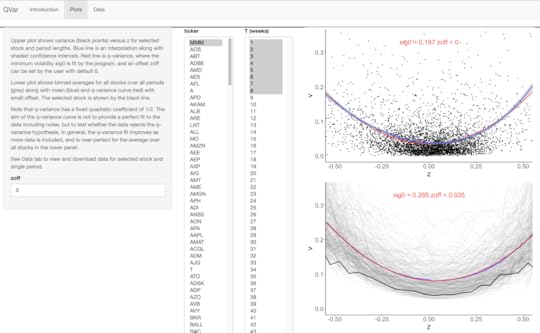
Plots tab – Choose a stock ticker and range of periods T (1–50 weeks).
The upper plot shows variance vs. z for selected periods.
Points: Variance from individual non-overlapping periods.
Blue line: LOESS interpolation with shaded confidence region.
Red line: Q-variance curve.
The lower plot shows the average for all stocks (grey) compared with the selected stock (black).
Data tab – View/download the time series for the selected stock, including prices and computed variables.
 Try it now:
https://david-systemsforecasting.shinyapps.io/qvar/
See also: QEF15 – A quantum oscillator model of stock markets 2: q-variance and the q-distribution


