Fun with incident data and statistical process control
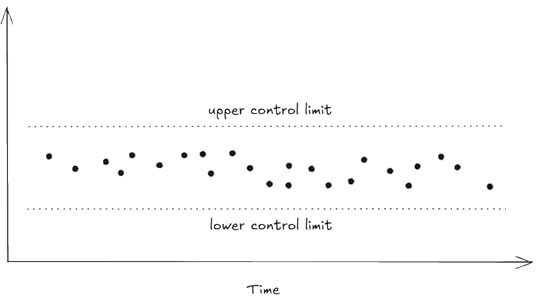
Last year, I wrote a post called TTR: the out-of-control metric. In that post, I argued that the incident response process(in particular, the time-to-resolution metric for incidents) will never be under statistical control. I showed two notional graphs. The first one was indicative of a process that was under statistical control:

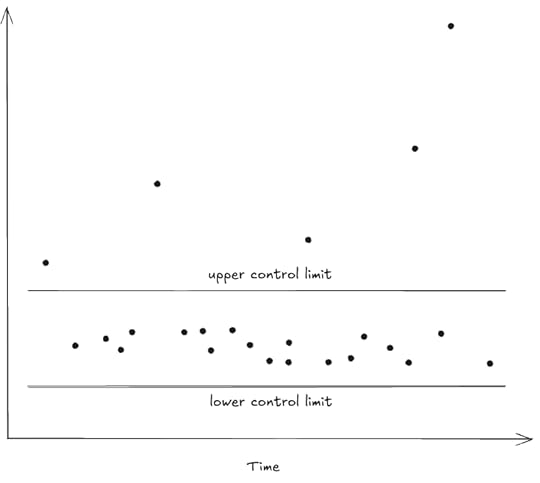
The second graph showed a process that was not under statistical control:

And here’s what I said about those graphs:
Now, I’m willing to bet that if you were to draw a control chart for the time-to-resolve (TTR) metric for your incidents, it would look a lot more like the second control chart than the first one, that you’d have a number of incidents whose TTRs are well outside of the upper control limit.
I thought it would be fun to take a look at some actual publicly available incident data to see what a control chart with incident data actually looked like. Cloudflare’s been on my mind these days because of their recent outage so I thought “hey, why don’t I take a look at Cloudflare’s data?” They use Atlassian Statuspage to host their status, which includes a history of their incidents. The nice thing about Statuspage is that if you pass the Accept: application/json header to the /history URL, you’ll get back JSON instead of HTML, which is convenient for analysis.
So, let’s take a look at a control chart of Cloudflare’s incident TTR data to see if it’s under statistical control. I’m going into this knowing that my results are likely to be extremely unreliable: because I have no first-hand knowldge of this data, I have no idea what the relationship is between the time an incident was marked as resolved in Cloudflare’s status page and the time that customers were no longer impacted. And, in general, this timing will vary by customer, yet another reason why using a single number is dangerous. Finally, I have no experience with using statistical process control techniques, so I’ll just be plugging the data into a library that generates control charts and seeing what comes out. But data is data, and this is just a blog post, so let’s have some fun!
Filtering the dataBefore the analysis, I did some filtering of their incident data.
Cloudflare categorizes each incident as one of critical, major, minor, none, maintenance. I only considered incidents that were classified as either critical, major, or minor; I filtered out the ones labeled none and maintenance.
Some incidents had extremely large TTRs. The four longest ones were 223 days, 58 days, 57 days, and 22 days, respectively. They were also all billing-related issues. Based on this, I decided to filter out any billing-related incidents.
There were a number of incidents where I couldn’t automatically determine the TTR from the JSON: These are cases where Cloudflare has a single update on the status page, for example Cloudflare D1 – API Availability Issues. The duration is mentioned in the resolve message, but I didn’t go through the additional work of trying to parse out the duration from the natural language messages (I didn’t use an AI doing any of this, although that would be a good use case!). Note that these aren’t always short incidents: Issues with Dynamic Steering Load Balancers says The unexpected behaviour was noted between January 13th 23:00 UTC and January 14th 15:45 UTC, but I can’t tell if they mean “the incident lasted for 16 hours and 45 minutes” or they are simply referring to when they detected the problem. At any rate, I simply ignored these data points.
Finally, I looked at just the 2025 incident data. That left me with 591 data points, which is a surprisingly rich data set!
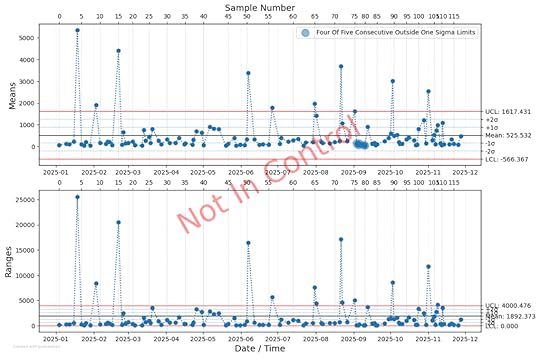
The control chartI used the pyshewhart Python package to generate the control charts. Here’s what they look like for the Cloudflare incidents in 2025:

As you can see, this is a process that is not under statistical control: there are multiple points outside of the upper control limit (UCL). I particularly enjoy how the pyshewhart package superimposes the “Not In Control” text over the graphs.
If you’re curious, the longest incident of 2025 was AWS S3 SDK compatibility inconsistencies with R2, a minor incident which lasted about 18 days. The longest major incident of 2025 was Network Connectivity Issues in Brazil, which lasted about 6 days. The longest critical incident was the one that happened back on Nov 18, Cloudflare Global Network experiencing issues, clocking in at about 7 hours and 40 minutes.
Most of their incidents are significantly shorter than these long ones. And that’s exactly the point: most of the incidents are brief, but every once in a while there is an incident that’s much longer.
Incident response will never be under statistical controlAs we can see from the control chart, the Cloudflare TTR data is not under statistical control, we see clear instances of what the statisticians Donald Wheeler and David Chambers call exceptional variation in their book Understanding Statistical Process Control.
For a process that’s not under statistical control, a sample mean like MTTR isn’t informative: it has no predictive power, because the process itself is fundamentally unpredictable. Most incidents might be short, but then you hit a really tough one, that just takes you much longer to mitigate.
Advocates of statistical process control would tell you that the first thing you need to in order to improve the system is to get the process under statistical control. The grandfather of statistical process control, the American statistician Walter Shewhart, argued that you had to identify what he called Assignable Causes of exceptional variation and address those first in order to eliminate that exceptional variation, bringing the process under statistical control. Once you did that, then you could then address the Chance Causes in order to reduce the routine variation of the system.
I think we should take the lesson from statistical process control that a process which is not under statistical control is fundamentally unpredictable, and that we should reject the use of metrics like MTTR precisely because you can’t characterize a system out of statistical control with a sample mean.
However, I don’t think Shewhart’s proposed approach to bringing a system under statistical control would work for incidents. As I wrote in TTR: the out-of-control metric, an incident is an event that occurs, by definition, when our systems have themselves gone out of control. While incident response may frequently feel like it’s routine (detect a deploy was bad and roll it back!), we’re dealing with complex systems, and complex systems will occasionally fail in complex and confusing ways. There are a lot more ways that systems break, and the difference between an incident that lasts, say, 20 minutes and one that lasts four hours can come down to whether someone with a relevant bit of knowledge happens to be around and can bring that knowledge to bear.
This actually gets worse for more mature engineering organizations: the more reliable a system is, the more complex its failure modes are going to be when it actually does fail. If you reach a state where all of your failure modes are novel, then each incident will present a set of unique challenges. This means that the response will involve improvisation, and the time will depend on how well positioned the responders are to deal with this unforeseen situation.
That being said, we should always be striving to improve our incident response performance! But no matter how much better we do, we need to recognize that we’ll never be able to bring TTR under statistical control. And so a metric like MTTR will forever be useless.


