The AI Effect
AI dominates. Everywhere you look someone is telling you which AI stock to buy. You can’t avoid it.
But almost nobody is asking a much more interesting question.
What happens when millions of investors start making decisions with the help of the same AI?
Technology always advances. And every advance in technology in the stock market eventually leads to the same question:
Does this change how markets behave?
The ITM answer begins with one simple observation:
The market is people. Not stocks. Not companies. People.
AI Stock PicksNo doubt you’ve been bombarded with ads claiming ‘AI Picks’ – here’s an example I see almost every day.
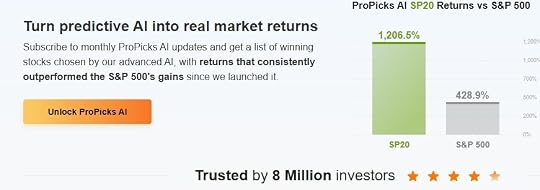
Now, what’s the most interesting stat in that ad? The claimed returns? Or:
‘Trusted by 8 million investors’
That’s a lot. Tens or hundreds of billions of dollars may be influenced by these systems. Its not just InvestingPro. There’s also Zacks Premium, Motley Fool AI, Seeking Alpha and others.
Typically they have 1-100 million users and influence hundreds of billions of dollars.
 It's just a little elephant
 Comparatively, it’s quite a small elephant
Retail AI platforms → millions of traders → hundreds of billionsRobo‑advisors → tens of millions → trillionsInstitutional AI → global funds → tens of trillionsBut it is still enough to move markets, and so we have to wonder:
What is the effect of AI stock picking services on ITM?
The Retail AI ElephantThey may be “small elephants” compared to robo‑advisors and institutional AI, but they still represent hundreds of billions of dollars moving in surprisingly synchronized ways. AI services:
synchronise actual trader behavioraccelerate reactionsAmplifies emotional contagionIncreases crowd homogeneity.Le’s take them one by one.
AI Synchronizes behaviorWhen millions – well, tens of millions possibly hundreds of millions – of traders see the same AI-generated ‘Top Picks’ guess what happens? They cluster into the same trades. This makes the ‘herd’ stronger, faster and more predictable.

Basically, AI pushes the crowd into alignment, and so crowd behavior is easier to read. Trends form more cleanly, breakouts have more force and reversals drop faster.
The effect? ITM has just become more reliable
 AI Compresses Time
 Instead of waiting until everyone had read the financial press, received their guru’s expert view, had a little chat on a forum, watched the charts for a couple of days – now AI summarizes news and highlights ‘opportunities’ instantly.
Alerts go out right away and millions of traders act on these alerts, so instead of reaction time taking a few days it now all happens in minutes. Trends start earlier, signals appear faster – all of which ITM thrives on.
AI Amplifies EmotionWe know that FOMO is a thing – but also that fear is stronger that greed. Millions of traders getting the same good or bad news at the same time is going to reinforce the mood of the market.
You just got a sell alert? Act first ask questions later. It’s a sure-fire buy? Better get on before everyone else does and the price goes up.
And, of course, once you have committed to the trade you are invested in being right – and convincing others!
AI creates consensusWhen millions of people use similar AI tools naturally they all start thinking the same way. Millions of people receive
the same summarythe same rankingthe same buy listthe same “Top Opportunity”That creates information convergence.
People aren’t becoming more rational,
they’re becoming more similar.
Which means there are stronger uptrends and sharper downtrends because everyone is doing the same thing.
The Stock Market is PeopleITM is based on the realization that the market is just a mass of people buying and selling stocks – based on emotion. AI does not change that – it just amplifies and speeds up the results.
Should ITM be worried?No. AI hasn’t changed the stock market. It has changed the speed at which people influence one another.
Markets are still driven by fear and greed. They are still crowds. If anything, AI may make those crowds larger, faster and more unified than ever before.
For investors trying to predict individual stocks, that creates new challenges.
For ITM, which simply measures the behaviour of the crowd, it may make the crowd even easier to read. The waves may get higher and faster – but we ride the tide.
 To the markets . . .
 Well, Thursday and Friday were decidedly nasty. Two days when I didn’t look at my accounts. I looked at the charts, of course, and drew in all sorts of mental lines. But not at the accounts.
Why not? Because human nature being what it is, I knew exactly what would happen. My subconscious would start its familiar commentary:
Last night you lost more than you used to earn in a year!
Do you realise you could stay in a lovely hotel in France for a whole year with that money??
And so on. It isn’t that I am avoiding reality – I’m watching the market closely. I’m monitoring the charts. I’m simply refusing to let my brain frame what is happening in a way that is emotionally unhelpful.
I know what it’s trying to do. It’s trying to keep me safe.
But I’m the boss of my brain – it isn’t going to push me around!
The market does not pay a salary.
It is not an income-producing machine.
It grows capital – and that’s something completely different.
And it is definitely not something to be trifled with. If you’re going to invest serious money, you need a proven plan, clear limits and the discipline to follow them – especially on days like these
Enough psychology. The market doesn’t care what I was thinking on Thursday afternoon. Let’s see what it actually did.
SPY ChartsThe strange thing is that the chart doesn’t look at all worrying. More ‘business as usual’. More consolidation. Still going sideways in the channel. And still above the halfway point.
What is disappointing was that it looked as though it was setting up for an upwards breakout – and, of course, we were hopeful. But alas; not last week.
Practicalities: while the 10 SMA has flatlined since May the 200 SMA has been trending upwards – so it looks as though if everything went pear-shaped the ITM OUT signal would be around 710. When we had the IN signal, SPY was trading around 690.
But let’s not rush to meet anything; we are still $43 from that happening.
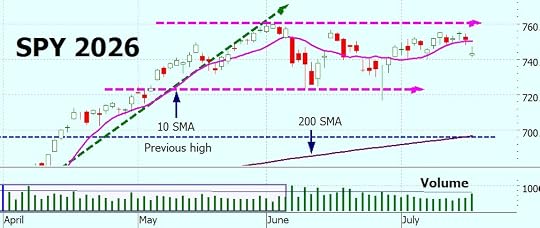
The weekly chart clearly shows the resistance at 760.
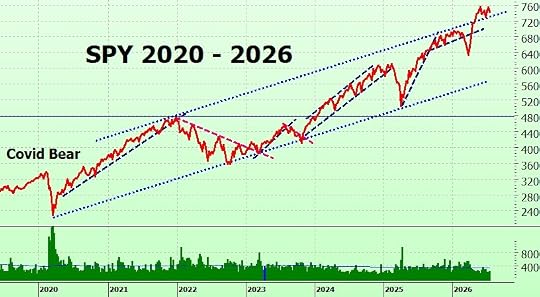 SPYG Charts
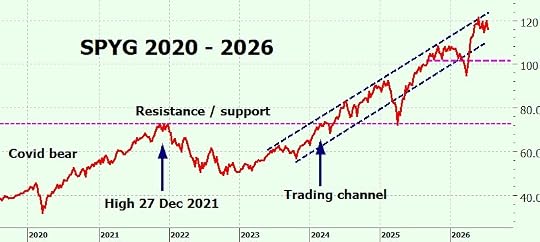
 The chart doesn’t look particularly scary: still trading sideways. Of course, we were hoping for a breakout to the north – but it didn’t happen. We’re back in the same consolidation channel. Not good, but not bad. Just sort of ‘meh’.
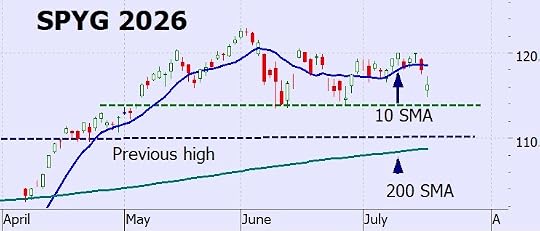
The long term chart clearly shows the hesitation at 120.
 QQQ Charts
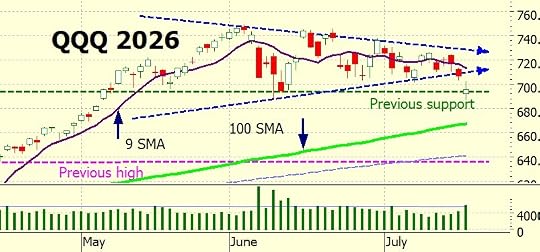
 This has been one of the weeks where QQQ diverges from the Nasdaq index – you may have noticed that while the Nasdaq went up, QQQ went down. (I can do a blog on that if anyone is interested – please let me know in the comments).
And while Thursday wasn’t worrying Friday definitely was. QQQ has now dropped out of the triangle, and is now sitting on the previous support level.
Will it hold?
Nobody knows, but it is something to be watched closely.
Re the ITM OUT signal if the current trajectory holds it could be around 695. Will it happen? Too early to tell.
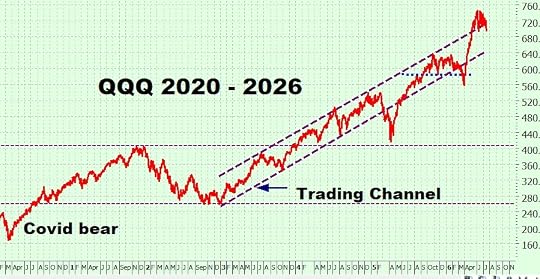
The long term chart shows that QQQ has got back into its trading channel. It this significant? Depends on who is commenting. Personally, I think that it is, that we will continue the uptrend just not quite as fast as we saw recently.
Does that mean it is going to happen? Of course not! The market does what the market does; it doesn’t care what I think!
 VIX Chart (Volatility)
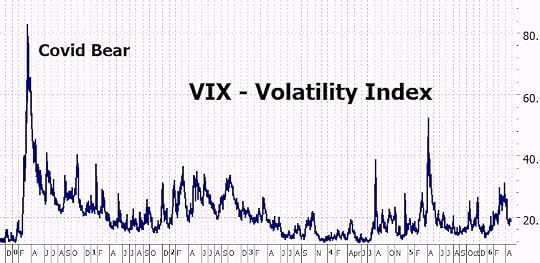
 Nothing special. Despite Thursday and Friday, it is still in low-volatility territory.
 ITMeter
  The week ahead . . .
 This week’s focus shifts from inflation to the strength of corporate America as second-quarter earnings season gathers momentum. Investors will be watching closely as Alphabet, Tesla and Intel headline a busy week of earnings, while Thursday’s PMI data and weekly jobless claims provide further clues about the health of the U.S. economy ahead of next week’s Federal Reserve meeting.
Monday
Reports: No major economic reportsEarnings: Domino’s Pizza, Steel DynamicsTuesday
Reports: State Employment & Unemployment (June)Earnings: 3M, General Motors, HalliburtonWednesday
Reports: State Job Openings & Labour Turnover Survey (JOLTS)Earnings: Alphabet (Google), Tesla, IBM, AT&TThursday
Reports: Weekly Jobless Claims, S&P Global Flash Manufacturing PMI, S&P Global Flash Services PMIEarnings: Intel, Texas Instruments, Honeywell, ComcastFriday
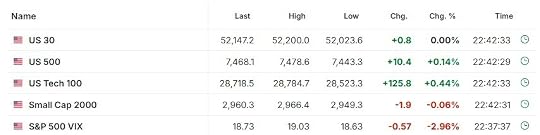
Reports: New Home SalesEarnings: American Express, Verizon The futures . .Seem quite calm. After 2 big down days that is a relief!
 The video & blog
 I’m finding that video lets me explain ideas in greater depth than is possible in a written article, so over time I’ll be developing my YouTube channel alongside the blog.
The videos will explore the article topic in more detail, while the market charts and commentary will continue to remain here in the blog.
Last week’s video was very much a learning experience – I rather ambitiously decided to make it at the last minute and spent most of my time trying to persuade the microphone to work! Hopefully this week’s effort is a step forward.
As always, I’d love to hear your ideas for future articles. If there’s a question you’d like me to investigate or a topic you’d like me to explore, please let me know in the comments.
Heather
Trade the tide, not the waves
Q & AThe post The AI Effect first appeared on Heather Cullen : In The Money Online.