Karen Martin's Blog
December 15, 2015
Lean for the Holidays

Over the past few days, I’ve received a number of clever holiday and Lean-themed videos, maps, and stories that I thought I’d share. I’m sure there are many more out there, so please feel free to share in the comments area. Enjoy!
Will Farrell, Quality Inspector?
This is a funny scene from the movie Elf where Will Ferrell performs quality control for jack-in-the-boxes:
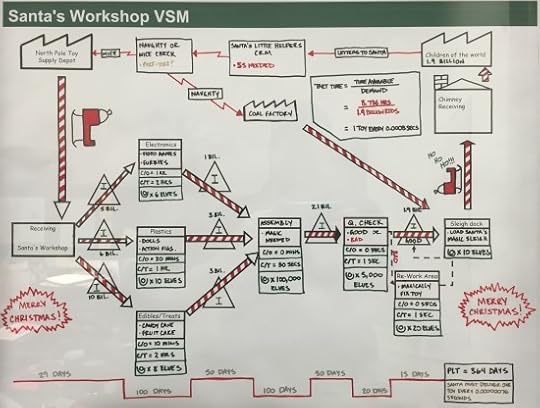
Santa’s Value Stream
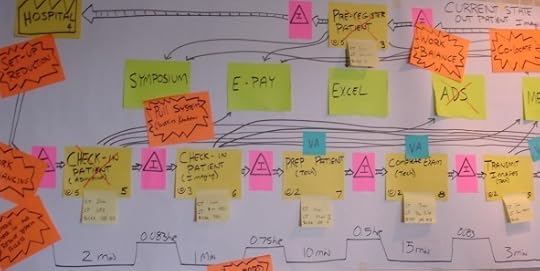
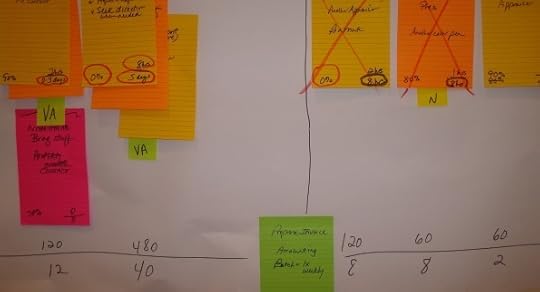
Here’s a clever value stream map, created by Jordan Kempler at TMAC:
Santa Believes in Kaizen!
And who knew that Santa was so Lean-savvy? Enjoy this story written by one of our subscribers, Tom Gardzinski.
With the total days of the year fixed and global population skyrocketing over the past 150 years, Santa had to figure out how to do more within the same time period. So Santa turned to continuous improvement. Santa and his elves learned about the eight operational wastes and the problem-solving methodology, Plan, Do, Study and Adjust (PDSA).
One problem they wanted to avoid was the toy shortage that they had experienced in 2011. Retailers were holding less inventory as a precautionary measure to avoid the losses they experienced a year earlier due to the recession and a slower-than-normal shopping season. But what Santa and the elves discovered was that could be traced back to excessive lead times at the largest toy manufacturing on the planet, Santa’s own workshop. With customers dissatisfied because they were not receiving product or had to settle for cheap knock-offs, Santa couldn’t ignore this problem. So he organized a Kaizen Event with a team of elves to discover how to reduce lead time through the elimination of non-value-added activities. The team discovered that they spent 50% of the overall lead time just getting the Christmas list orders to the production floor.
First, they eliminated excessive approvals, which shortened lead time by a few days. Then, by removing the outdated mailroom and upgrading to a sophisticated mail scanning system, Santa’s Workshop was able to transfer the mailroom staff onto the toy production floor to help wrap the toys as they came off the production line. The team started to realize how removing non-value added waste is critical in fulfilling children’s wish lists. This new mail scanning system helped reduce 5 of the 8 wastes; overproduction, over-processing, waiting, inventory, motion, and under-utilization (lost creativity) of people. (Images used by permission by Jerome Holst, Enchanted America and Candice Russell, Pitney Bowes.)


Another waste that the team discovered was the amount of batch processing that was in place. Children had been sending their Christmas wish lists only three weeks before Santa had to saddle up! To level external demand, Santa offered incentives to all children who sent their wish lists by November 15 of each year. Spreading the work out over a longer time period allowed for less overtime which meant happier and healthier elves! The children were also thrilled because they received bonus gifts on Christmas morning as a reward for sending in their wish list early.
The above are just two CI events that have been highlighted from the last five years at Santa’s Workshop, and they’re still working on improvements to keep up with growing toy demands!

I hope you’ve enjoyed a little Lean humor and holiday cheer! May you and your family have a joyful Christmas, Hannukah, Kwanza, or whatever you celebrate.
And may 2016 bring you:
Outstanding health, happiness, and prosperity
Intellectual, emotional and spiritual fulfillment at work
Deepening humility, curiosity, and respect for humankind
Continued success in developing proficiency in leading improvement
And may we all experience greater peace on earth and an end to senseless violence.


January 27, 2015
The Human Side of Value Stream Mapping

When you think of value stream transformation, what are the most common desired outcomes that come to mind? Shorter lead times? Higher quality? Reduced expenses? Expansive thinkers often go beyond these classic performance indicators and aim for improvements such as shorter-to-market time for new products, greater market share, smoother acquisitions, and less painful annual budgeting cycles. These are all noble pursuits that can be accomplished more easily through the proven practice of value stream mapping. However, in our experience, the deepest transformational benefits from well-executed value stream mapping activities are often people-based.
In a recent interview with Ron Pereira of Gemba Academy, I shared a common outcome of value stream mapping efforts: organizational healing.
In my view, improvement and organizational transformation are deeply psychological. Looking exclusively for tangible results ignores the reality that people are psychological beings. Being aware of and playing into human psychology can be tremendously healing—for both the individuals involved and the organization-at-large.
There are two key conditions value stream mapping helps create that are wickedly effective in achieving quantifiable performance improvement and are also humanistic at their core:
1. Leadership Alignment
The word “alignment” has been bandied about so much that it has achieved buzzword status. Buzzword or not, leadership alignment is critical for achieving outstanding performance. And it’s often missing.
 In our initial work with leadership teams, they’ll often declare, “Of course we’re aligned!” But when we listen to conversations, observe body language, and learn how an organization solves problems, we often see moderate to high degrees of leadership misalignment over issues that are fundamental to an organization’s success. Appearing to play well in the sandbox with one’s peers is not a valid indicator of what’s going on psychologically. And, what’s going on psychologically in every leader’s head is directly tied to how well the organization will perform.
Alignment is NOT present when one leader believes the organization should offer a new service or move into a new geographic area, while another believes the organization should focus on fundamentals. Alignment is NOT present when one leader believes that a certain type of work belongs in his/her part of the organization and another leader believes it belongs elsewhere. Alignment is NOT present when one leader believes that one part of the organization is under-performing, while another leader doesn’t see it.
Value stream mapping helps a leadership team align around organizational purpose, strategic direction, annual business goals, and improvement priorities. It provides a powerful forum for leaders to gain clarity, focus, consensus, and commitment.
Done well, value stream mapping shines a light into cobwebbed corners of an organization and allows them to be cleared. It surfaces the truth—unequivocally and unapologetically. It reveals the cracks in a company’s operation, the financial model it uses, how it sells its goods or services, and how it treats its suppliers, customers, and employees. It uses facts to challenge leadership biases and misperceptions. But it also creates a safe haven for the crucial conversations that need to occur so that the organization can heal itself and accelerate its journey to excellence.
With a newfound understanding of reality, leadership teams typically come together in profound ways. (It also surfaces very clearly when a leader will remain misaligned and needs to find a new home!) With a shared commitment for the future state and the improvement priorities needed to get there, they morph into a cohesive, collaborative whole that spreads to the frontlines and fuels the transformation process.
2. Easier Work
The second outcome that speaks to the human side of value stream mapping is around the work itself. Respect for people is a core tenet of Lean management and goes far beyond how one is treated in meetings, in hallways, and in the cafeteria. In fact, the greatest measure of how much respect for people is present in an organization is the degree to which each individual can succeed in doing his/her work and fully utilize his/her knowledge, skills, aptitude for learning, and creative potential (KSAC).
 Unfortunately, in many organizations, people are forced to work with kludgy work systems and processes that make it impossible to be successful, no matter how well-intended and highly skilled one is.
To make matters worse, people are often blamed for problems instead of first looking at the systems and processes that created the environment for the problems to occur.
Gathering a leadership team together to understand the current state of how value flows (or doesn’t flow) to customers creates a powerful venue for seeing how difficult it can be for staff to be successful. After the current state discovery process, many leaders have admitted that they were embarrassed by what they learned. But while developing a deep understanding of the current state can be sobering, it provides the leadership insight needed to launch true organizational transformation.
The process of streamlining workflows, closing gaps, correcting disconnects, and reducing redundancy and rework provides not only greater value for external customers, but a more humanistic and respectful work environment for the people who deliver that value.
Value stream mapping is far more than a tool to achieve quantifiable business performance improvement. It’s a management practice that helps build an appetite for surfacing the truth, solving problems, resolving complacency, and designing a better tomorrow. It helps an organization realize its full potential. And, done well, it deepens understanding, heals relationships, and brings a human side to business.
August 5, 2014
Eliminate the Need for Heroics

Any leader or skilled improvement professional knows that metrics are necessary to define what success looks like, measure progress toward a defined target, and assess performance against defined standards. Metrics also serve as a powerful way to demonstrate improvement success to people who might otherwise roll their eyes.
Used properly, relevant metrics provide the much-needed fuel for better decisions, better problem solving, and better improvement. Unfortunately, all too often, organizations operate with a “empty tank” with few, if any, metrics that matter. Data is one thing; meaningful information is quite another.
But as powerful as metrics can be, there are many noble improvement goals for which measuring success is difficult or impossible. Some of the greatest minds recognized this reality.
Consider the saying that’s been attributed to both Albert Einstein and William Bruce Cameron: “Not everything that counts can be counted. Not everything that’s counted counts.” (“Matters” is sometimes used in lieu of “counts” and “measured” is sometimes used in lieu of “counted.”)
W. Edwards Deming echoed this maxim in Out of the Crisis:
“One can not be successful on visible figures alone. Now of course, visible figures are important. There is payroll to meet, vendors to pay, taxes to pay; amortization, pension funds, and contingency funds to meet. But he that would run his company on visible figures alone will in time have neither company nor figures. Actually, the most important figures that one needs for management are unknown or unknowable.” (p. 121; he credits the last statement to statistician Lloyd S. Nelson)
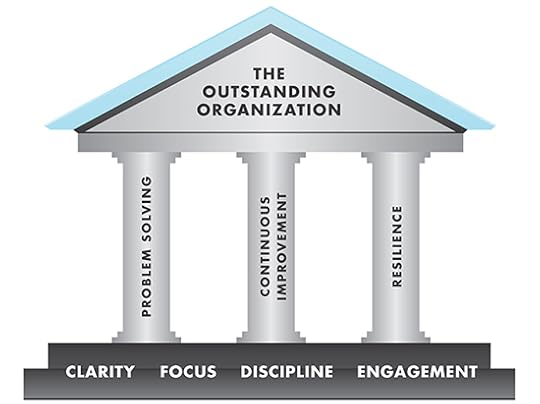
In The Outstanding Organization I defined four behaviors that I have found provide the necessary foundation (and are often lacking) for achieving outstanding business performance: clarity, focus, discipline, and engagement.
Without those behaviors firmly in place, organizations produce varying degrees of self-inflicted chaos. The most common and destructive type of chaos is more commonly referred to “fire fighting.” In many organizations, fire fighting has become such a normal behavior that, like a fish in water, they don’t even realize that they’ve habituated chaos into their daily operations.
In the most extreme cases, organizations encourage fire fighting because they habitually reward the heroine or hero who saves the day and they do not reward the people working to prevent chaos. After all, chaos is exciting! It gets our juices flowing! But it’s all too easy to become an adrenaline junkie. Like any addiction, being hooked on adrenaline will bring you down.
How does this relate to measurement? Improvement is defined as reducing (or closing) the gap between a defined current state and a target condition you’re aiming to achieve. If your organization is hooked on fire fighting, your target condition is to reduce (ideally, eliminate) the need for fire fighting. After you identify the root causes for fire-fighting (there will be several) and test, adjust, and implement the countermeasures that will address the “vital few” root causes that are causing the bulk of the pain, it’s time to measure your success. How do you know if you’ve successfully reduced or closed a nebulous gap?
One way to quantify a reduction in chaos is to conduct brief employee surveys. Another is to simply get anecdotal feedback to the question: “Does it feel better?”
Yes. “Does it feel better?” is a legitimate question.
While I’ve often admonished improvement teams, “It can’t just feel better. It needs to be measurably better,” it’s also true that there are a some wildly important improvements that may be tougher to measure, but are simply the right thing to do. You may not be able to draw a direct cause-and-effect correlation between chaos reduction and an increase in profit, market share, or employee engagement, but reducing the need for heroics remains a noble goal.
Work shouldn’t require heroics to get it done and get it done well. Outstanding organizations continuously strive to create work environments where successful performance isn’t dependent on heroics. Where people can be proud of the deliverables they create versus rushing through everything and delivering suboptimal output. Where leaders sleep at night versus wondering if deadlines will be met. Where customers don’t have to regularly call the customer service center because… well, there’s no need to. Where stress levels are in check and employee joy is palpable. Being proud, reduced stress, sleeping, joy… they may not be easy to measure, but….
Don’t you want to be one of those organizations?
June 16, 2014
Leadership: What’s Love Got to Do With It?

In 2012, I spoke at the Lean HR Summit, which is one of the many excellent annual Summits delivered by Lean Frontiers. I had heard about David Veech‘s work (@DavidVeech) at Ohio State and was eager to hear him speak. So I settled into my chair, ready to hear David’s take on the interplay between Lean principles and HR practices. But that’s not what he talked about—at least not explicitly. What David talked about was love. Come again? Love? In business?
In retrospect, I suppose I shouldn’t have been surprised. After all, one of W. Edwards Deming’s greatest contributions to business management is #8 of his 14 Points for Management: Drive out fear. And I’ve understood for quite some time now that all of our feelings and behaviors can be distilled down to two primal human emotions: love and fear. So to drive out fear, we have to replace it with love. Makes sense.
David went on to deliver one of the most compelling keynotes I’ve heard and his words deepened the quest I’ve been on to uncover the keys to consistent, outstanding business performance. One thing that’s clear is that love and fear play a critical role. Likely THE most critical role. We have to build cultures of love in order to have cultures devoid of fear.
Uncomfortable with the words love and business in the sentence? Simon Sinek’s most recent TED Talk is arguably his best yet and is laced with Lean leadership principles, even though he never mentions the word Lean. What he does mention is love as a precondition to establishing a culture of trust and cooperation, which leads to significant business results. This 12-minute talk packs a powerful punch.
Similar to a post I penned last week for Switch and Shift and I address in The Outstanding Organization, Sinek talks about the need to create the environment that enables people to perform at their best.
Sinek says it best:
“When a leader makes the choice to put the safety and lives of the people in the organization first, to sacrifice the comforts, to sacrifice the tangible results so that the people remain feel safe and feel they belong, remarkable things happen.”
Take a look and then read on (If you’re pressed for time, I’ve listed some of Sinek’s key points at the end of this post):
In The Outstanding Organization (TOO), I talk about the establishing a work environment that fosters “reciprocal nourishment,” a term I learned from clinical sociologist Kathryn Goldman Schuyler. While writing TOO, I never even thought the word love. I do now.
In last week’s webinar about Respect for People: The Lean Way, I address the need to build work environments that draw on and are highly respectful of the full set of knowledge, skills, aptitude and creativity (KSAC) each employee brings to a job. In doing so, business performance soars. This webinar was the first time I mentioned the word “love” and “business” in the same sentence (at 6:00). It felt very right.
I believe we’re on the cusp of a major transformation in business and the way leaders lead. Command-and-control never worked and it especially doesn’t work with Millennials. One of my favorite little books released in the past two years is Help Them Grow or Watch Them Go by Beverly Kaye and Julie Winkle Giulioni. People are starved for feedback, learning, and development. They are not merely widgets to do a company’s bidding. When companies create environments where love and respect for humanity drives all decisions and behavior, they become unstoppable.
Spread the word. Say the word. Love. When it comes to achieving outstanding business performance, love’s got a LOT to do with it.
Here are some of my favorite Sinek-isms from his TED Talk:
“In the military, they give medals to people who are willing to sacrifice themselves that others may gain. In business, we give bonuses to people who are willing to sacrifice others so that we may gain.”
Wow. Jarring statement, but it’s often true. Let’s change that. Another good one:
“When a leader makes the choice to put the safety and lives of the people in the organization first, to sacrifice the comforts, to sacrifice the tangible results so that the people remain feel safe and feel they belong, remarkable things happen.”
Indeed. In environments where people don’t feel safe, trust and cooperation is non-existent and the truth about anything can become unknowable. How ’bout this pearl:
“Leadership is a choice. It is not a rank.”
Enough said.
And about layoffs, a key Lean principle. Pay particular attention to the story about Bob Chapman (8:26), a deeply-respected Lean leader who believes in “heart counts” instead of “head counts”:
“Great leaders would never sacrifice the people to save the numbers. They would sooner sacrifice the numbers to save the people.”
And finally:
“If you get the environment right, every single one of us has the capacity to do these remarkable things. And more importantly, others have that capacity too.”
(Hat tip to Jean Cunningham for mentioning Sinek’s TED Talk in her May newsletter.)
May 28, 2014
The Case for Kaizen Events

One thing that there’s no shortage of in life is criticism about things we don’t fully understand—or haven’t experienced success with. Another thing there’s no shortage of is throwing the baby out with the bathwater. Broad generalizations—especially those that are patently untrue—serve no one.
Enter Kaizen Events—also known as Kaizen Blitzes, Kaizen Workshops, Rapid Improvement Events (RIEs), Rapid Process Improvement Workshops (RPIWs), and a host of company-branded terms. Some people equate “Workouts” (a term used for an improvement method popularized by General Electric) with Kaizen Events, though there are striking differences—at least in terms of how Mike Osterling and I define Kaizen Events in our book, The Kaizen Event Planner (And good news! TKEP has just been released in e-book form).
While the exact genesis of Kaizen Events is unclear, it appears to be tied to a convergence of interest from Danaher executives who were working with the consulting firm Shingijutsu in the late 1980′s and the Northeast Region of the Association for Manufacturing Excellence (AME). According to Jon Brodeur’s introduction in AME’s The Kaizen Blitz:
“Our decision to structure the Kaizen Blitz as a three-day event came down to economics; three days was the right amount of time people could spend away from their companies and still get a good taste of the approach. Three days would not magically transform the organization, but a three-day blitz would give management and people at all levels a good idea of what could happen in a concentrated effort driven by human creativity.”
So here we are—20 or more years since Kaizen Events were born. We’ve learned a lot about what works and what doesn’t. But I’m concerned with the degree to which Kaizen Events are derided by some of the leading voices in the Lean movement. One notable Lean thinker recently wrote: “Who has time for the hugely wasteful & mechanical five-day kaizen events?” Are you kidding me? Hugely wasteful? Mechanical? That’s not at all my perspective and extensive experience with the methodology. Perhaps we need to reboot our Kaizen Event engine and learn how to use them responsibly and effectively.
Here’s how:
1. View Kaizen Events as transformation “practice sessions.”
Kaizen Events offer an efficient and effective method for achieving more than improvement to specific processes. Sure, the methodology offers a powerful venue for solving problems quickly. However, the cognitive learning, skill development, and psychological and behavioral shifts that occur with well-executed Kaizen Events offer even deeper and longer-lasting benefits.
Organizational transformation is contingent on drawing clearer lines between leadership’s role in setting strategy and drawing on workforce experience and creativity to solve problems at a tactical level. Kaizen Events offer a powerful training ground for achieving this shift. Leaders get more skilled in determining what needs to happen; the people who do the work become authorized and progressively more skilled in determining how. This shift ultimately frees leaders’ time so they can focus on their primary role—vision and strategy—and produces high levels of engagement all the way to the frontlines.
Kaizen Events also offer an efficient and effective way to teach critical thinking and develop proper problem-solving skills to 6-10 people at once. Putting a problem through its plan-do-study-adjust paces (for a full description, see pp 120-132 in The Outstanding Organization), helps habituate proper problem solving across an organization. Encouraging a team to repeatedly kick the tires and ask “why?”, “why not?”, and “what if?” creates a way of thinking that has far-reaching benefits.
Kaizen Events also offer a powerful way to replace unhealthy organizational habits with healthy ones. Done well, Kaizen Events help organizations learn how to:
See work through the holistic lens that reflects reality. Organizations that are structured solely by function create an environment where no one person understands the way work truly flows and value is delivered to a customer. No one. Now that’s plain silliness and the subject for a different post. But even if an organization isn’t prepared to challenge its existing structure, Kaizen Events result in a team of 6-10 people who FINALLY understand how work flows (or, more commonly, doesn’t flow) across a large swath of the organization. As a team member on last week’s Kaizen Event admitted during a interim briefing to leaders (that included some of the most senior leaders in the organization): “I thought my portion of the process was perfect! (Laughter) And then I found out how much I contributed to the problem.” Kaizen Events build holistic thinking that results in greater collaboration, cooperation, and decision-making all of the time, not just in Kaizen Events. And it creates a pool of people who are far more knowledgeable about the business and what customers value, which is a boon for developing up-and-comers and building a customer-focused operation.
Build proper meeting management skills. Many organizations have highly dysfunctional meeting management practices. Properly planned and executed Kaizen Events build skills around establishing clear meeting objectives, involving the proper people (no more and no less), starting and ending on time, sticking to scope, etc. Another participant on last week’s Kaizen team said: “Wow. If only all of our meetings were conducted like this!”
Build strong collaborative problem-solving skills. By design, Kaizen Events move fast. Having only 3-5 days to solve long-standing problems requires that people learn how to ask the right questions, listen deeply, avoid side conversations, and avoid talking over each other. This last one is particularly important—many organizations have a habitual pattern of talking over each other and having multiple conversations going on at once. Like fish in water, most don’t even recognize that the problem exists. The “ground rules” in effectively facilitated Kaizen Events disallow this behavior, which team members quickly embrace and value. And I know I’ve truly succeeded as a facilitator if, by the end of the Event, team members begin asking the types of questions that only I asked on day one. When the facilitator can take a back seat to the improvement process, this is true success!
But notice that I referred to Kaizen Events as transformation “practice sessions.” I didn’t say that they were the way you play the game all of the time. At some point, rapid improvement by focused cross-functional teams needs to become the natural way an organization conducts its business and formal Kaizen Events need to be few and far in between.
2. Tie Kaizen Events to a larger strategy.
For all of the benefits listed in #1, who wouldn’t want to give Kaizen Events a try? Well, before you grab that hammer out and begin looking for nails, understand that Kaizen Events need to be tied to a larger strategy or they become reduced to “drive-by kaizen,” “Kamikaze Kaizen,” or, my favorite that I learned from a colleague many years ago, “Random Acts of Kaizen.”
Kaizen Events are first and foremost a method for executing. Proper Kaizen Events don’t result in a plan for making improvement. The improvement occurs right then and there. So you can technically use them any time you want to execute rapidly. But they should be linked to something larger that’s a top priority for the organization. For example, problem owners and problem teams using the A3 methodology for problem solving can turn to Kaizen Events as a means to rapidly design, test, and implement the countermeasures needed to solve a specific aspect of a problem. Organizations who are improving an entire value stream can use Kaizen Events to rapidly design, test, and implement the various countermeasures that are needed to achieve the future state value stream as a mapping team has designed. (But note that value stream mapping should PRECEDE Kaizen Events, not be part of them. See Value Stream Mapping for more details.) But, in all cases, Kaizen Events should be tied to something larger (Hoshin Plan, A3, Value Stream Map, etc.) to make the best use of these resource-intensive activities. Running Kaizen Events just because you want to or know how to simply doesn’t make good business sense.
3. Balance Kaizen Events with building daily kaizen chops.
I believe that most of the people who trash talk Kaizen Events do so because they see organizations who can’t seem to make improvement in any other way and haven’t made much, if any, progress in creating continuous improvement cultures.
If you view improvement in degrees, well-executed Kaizen Events are similar to double or triple hits in a baseball game. Large, well executed, multi-month projects are the organizational equivalent of home runs and grand slams: thrilling, but difficult to achieve. Consistent “single hits” that move runners from base to base are how games are won. Achieving consistent single hits is also what results in the “magic of Lean,” described by a long-standing client CEO:
“In my experience leading organizations through the Lean Journey, there’s a magic moment, a tipping point, where a critical mass of believers engage their hearts and souls into making their work simpler and easier. All of the workforce development, daily kaizen, Kaizen Events, and project teams finally kick into a natural unconscious behavior. The power of incremental improvements creates inertia that delivers profit to the bottom line. No one is really sure what exactly is driving the financial improvements. It’s not an event; it’s a change of culture, a new healthier, happier company. That’s what I call the Magic of Lean.”
As I mention in The Outstanding Organization (p. 172), you must include Kaizen Events in your portfolio of improvement methods. “Rapid improvement is energizing to workers and leadership teams alike, and provides an effective means to break organizational habits that slow execution.” Kaizen Events are a way to formally pass the baton from leaders to the front lines, and tie tactics to strategy. They’re an effective way to change behavior at all levels. Which gets us back to point #1 and the myriad of benefits Kaizen Events offer.
The bottom line? Don’t reject a concept just because it’s not executed properly much of the time. Nor because it’s used indiscriminately instead of purposefully. Instead, vow to help the organizations we touch learn how to harness the power that Kaizen Events offer and used them as a balanced approach to creating organizational transformation.
For assistance in using Kaizen Events as a balanced approach to transforming and achieving rapid results, please contact us to schedule a facilitated Event or facilitator development program. Or check out The Kaizen Event Planner in either paper or e-book form.
May 1, 2014
Decision-Making Hierarchy

As many of you know, I’m a rabid fan of clarity (along with focus, discipline, and engagement, the foundational organizational behaviors that I address in The Outstanding Organization).
In many organizations, the opposite of clarity—ambiguity—is the productivity-sapping, chaos-producing norm. By trading ambiguity for clarity, organizations create work environments that result in better decisions, greater alignment toward common goals, higher levels of engagement, and lower labor and operating costs due to excessive clarification and rework.
Operating with clearly defined roles and responsibilities is one of the many areas I cite in my book as a key contributor to high levels of employee engagement and, by extension, outstanding business performance (p. 45). I’m not alone in raising this issue. At 1:40 in the below video (https://www.youtube.com/watch?v=YgHW5bQuzGI), you’ll hear Leah Haunz Johnson from the Corporate Executive Board’s Corporate Leadership Council echoing this need:
Yesterday my business coach, Michael Stratford, and I had a conversation about the various levels of involvement people play in a business and in providing value to customers (e.g., full- and part-time staff, subcontractors, investors, advisors, collaborators, and strategic partners), and the need to be extremely clear about each party’s role in decision making.
Michael shared a decision-making taxonomy that he learned from Carolyn Taylor (author of Walking the Talk), which struck a clarity-defining chord in me. The levels of decision-making authority are:
I decide
You give input and I decide
We decide together
I give input and you decide
You decide
All parties benefit by being intentional and clearly communicating the level of decision making authority we’re operating from (which varies, depending on the decision to be made). Imagine a world with this level of clarity. No more wondering if you’re authorized to make a decision or not. No more irritation because someone made a decision they weren’t authorized to make. No more frustration with people who aren’t making decisions that are theirs to make simply because they didn’t know they had the authority to do so.
Eureka! I hope you’ll join me in practicing intentional decision making—both at work and in life. I invite you to share your results and lessons learned.
Intentional Decision Making
As many of you know, I’m a rabid fan of clarity (along with focus, discipline, and engagement, the foundational organizational behaviors that I address in The Outstanding Organization).
In many organizations, the opposite of clarity—ambiguity—is the productivity-sapping, chaos-producing norm. By trading ambiguity for clarity, organizations create work environments that result in better decisions, greater alignment toward common goals, higher levels of engagement, and lower labor and operating costs due to excessive clarification and rework.
Operating with clearly defined roles and responsibilities is one of the many areas I cite in my book as a key contributor to high levels of employee engagement and, by extension, outstanding business performance (p. 45). I’m not alone in raising this issue. At 1:40 in the below video (https://www.youtube.com/watch?v=YgHW5...), you’ll hear Leah Haunz Johnson from the Corporate Executive Board’s Corporate Leadership Council echoing this need:
Yesterday my business coach, Michael Stratford, and I had a conversation about the various levels of involvement people play in a business and in providing value to customers (e.g., full- and part-time staff, subcontractors, investors, advisors, collaborators, and strategic partners), and the need to be extremely clear about each party’s role in decision making.
Michael shared a decision-making taxonomy that he learned from Carolyn Taylor (author of Walking the Talk), which struck a clarity-defining chord in me. The levels of decision-making authority are:
I decide
You give input and I decide
We decide together
I give input and you decide
You decide
All parties benefit by being intentional and clearly communicating the level of decision making authority we’re operating from (which varies, depending on the decision to be made). Imagine a world with this level of clarity. No more wondering if you’re authorized to make a decision or not. No more irritation because someone made a decision they weren’t authorized to make. No more frustration with people who aren’t making decisions that are theirs to make simply because they didn’t know they had the authority to do so.
Eureka! I hope you’ll join me in practicing intentional decision making—both at work and in life. I invite you to share your results and lessons learned.
April 24, 2014
Value Stream Mapping: Ferrari or Pinto?

Mike Osterling and I decided to write our latest book, Value Stream Mapping, to deepen people’s understanding about this powerful improvement methodology. In particular, we wanted to help the many organizations that:
Remain unfamiliar with the practice
Underutilize the method
Misuse the tool
Notice that I refer to value stream mapping as a practice, a method, and a tool. Used properly, it’s all of these things.
This post addresses #2 and #3 above. In skilled hands and in an organization with sufficient will, value stream mapping can generate “Ferrari results.” But all too often, we see organizations achieving “Pinto results.” (Yes, I recognize that I’m dating myself by mentioning the plight of the Pinto.)
I’d like to see more Ferraris racing down the improvement highway on their journey to outstanding organizational performance. Ferraris are known for rapid acceleration, tight steering and responsiveness, and the ability to navigate hairpin turns with precision. What organization wouldn’t want to possess those same traits?
The way to achieve Ferrari results is to avoid six common failings:
1. Mapping Solely as a Work Design Exercise
All too often, we see people using value stream maps mechanistically as a tool solely to improve value stream performance. You may be thinking, “So what’s wrong with that? Isn’t value stream improvement the point?” Definitely. But why stop there? Why aim solely for value stream performance improvement when you can also achieve cultural shifts, build stronger leadership teams, and accelerate your organization’s ability to learn?
By involving leaders, using an effective Charter to communicate and gain consensus, holding daily briefings, and managing a clearly defined transformation plan, organizations learn how to operate with higher degrees of clarity, focus, discipline, and engagement.
2. Mapping to Make Tactical Improvements
While value stream maps are very different from process maps, many people confuse the two techniques. VSMs view work holistically—from macro perspectives—and the outcome is an improvement strategy. Process maps view work from micro perspectives and provide the means for tactical improvement.
This key difference creates the need to involve different teams (leaders vs. front-line) in creating the maps. Leaders have the authority to make strategic future state design decisions, whereas the average manager or front-line worker doesn’t carry that authority.
3. Creating VSMs During Kaizen Events
Related to #2 above, Kaizen Events are focused, highly structured improvement activities where execution of change is the goal (vs. a value stream improvement plan) and involve a sequestered team primarily of the people who do the work being improved. Value stream maps involve primarily the people who oversee the work being improved and who, therefore, carry the authority to make strategic decisions concerning policy, functional involvement, and customers.
Again, kaizen events are tactical; value stream maps are strategic. If improving the value stream is the goal, value stream mapping is done well in advance of the kaizen event(s) that may be used to address the specific improvement needs identified during value stream mapping.
4. Creating Maps but Taking No Action
There’s no sense in going through the effort of creating value stream maps unless you’re going to move straight into making improvement. All too often we see beautifully created value stream maps hanging on a wall, but no action has been taken to realize the future state design.
Many organizations are far more comfortable and proficient with design than execution. The execution that follows value stream mapping can help break deep-seeded organizational habits of slow or no action, to that turning intention into results becomes second nature.
5. Mapping with the Wrong (or No) Team
This is arguably the greatest value stream mapping “sin.” Let me be clear: value stream mapping is a team sport. It is not meant for belts of any color or CI champions to execute on their own. After all, a baseball team’s not going to win many games if the pitcher’s the only one practicing. Nor—recalling numbers 2 and 3 above—should value stream maps be created solely by middle managers, team leads, or front-line staff who aren’t authorized to make significant future state design decisions.
it bears repeating: value stream mapping is a leadership-heavy activity because it results in leadership-level decisions about the future state. Middle managers don’t typically possess big-picture thinking nor the authority to design a future state that yields the type of significant results that are common when value stream mapping is well-executed.
As an example, a recent leadership-heavy value stream mapping team projects the future state will result in: shortened order fulfillment lead time from 17.5 weeks to 7 weeks, freed capacity equivalent to 22 FTEs (full-time equivalents), and an additional $25 million in working capital. It’s unlikely that a manager-level or below mapping team would have designed a future state that could achieve these projected results.
6. Maps with No Metrics
You can’t measure success without a baseline from which to measure. Wanna lose 5 pounds? If you don’t know that you started from a baseline of 150 lbs and that you now weigh 143 lbs, you’ll never be able to declare victory. The same logic applies to business. Yet, we frequently see so-called value stream maps without metrics of any sort.
The first question I ask when being brought in to lead value stream improvement is: “What problem are you trying to solve?” (A problem is a gap between where you are and where you’d like or need to be.) This question is closely followed by: “How do you know you have a problem?” Without metrics, both questions are nearly impossible to answer. And if you can’t answer those questions, you should probably move on to another problem. After all, in most organizations, there’s no shortage of problems to be solved!
By avoiding these common value stream mapping pitfalls, you’ll be able to begin achieving Ferrari-like results and zip down the improvement highway at speeds that you never thought were possible. Pintos didn’t accelerate nor navigate very well, and when a little force was applied had the propensity to explode.
So which would you rather have: a Ferrari or Pinto? The choice is purely yours.
Visit www.bitly.com/VSMbk to purchase Value Stream Mapping through Amazon.
April 8, 2014
Value Stream Mapping: Lead Time

One of the joys of writing a book is interacting with readers. Many authors experience head-slapping “duh!” moments as they hear questions and realize that they left out an important detail or could have provided an example to clarify. Now that Value Stream Mapping has been released, great questions are starting to roll in—along with the need to clarify a few points.
This post addresses a question about Lead Time (LT) that has been asked by several readers who work in manufacturing. The question has taken several forms:
Why do you treat lead time differently in your book?
Why don’t you convert inventory (note: we prefer to call it work-in-process) that has accumulated between process blocks to time? Similarly, how does your version of lead time differ from converting work-in-process into time?
Why don’t you place lead time on the peak of the sawtooth (square wave) timeline?
Disclaimer: If you’re haven’t ever mapped a manufacturing value stream, you may find this post a bit confusing and may be better off not reading it. :-)
First, a little background…
As we mention in the Acknowledgements section of Value Stream Mapping, “Very few people know how many times and for how many years we considered writing this book and then decided against it. We felt that the value stream mapping ship had sailed.” We go on to explain that we wrote it to close the significant gap that existed about how best to apply value stream mapping in office, service, and knowledge work environments.
We also wanted help those in manufacturing learn how to get deeper results by using value stream mapping as a management practice versus viewing it solely a workflow design tool. (More about this in a webinar I’m giving on Wed April 23 hosted by Gemba Academy. Click here to register: www.gembaacademy.com/webinars/martin-vsm.)
Therefore, in the mapping “mechanics” chapters of Value Stream Mapping that address how to physically create current and future state value stream maps (chapters 3 & 4), we intentionally didn’t include manufacturing mapping icons, terminology, and metrics. Because that book had indeed been written (Mike Rother & John Shook’s Learning to See).
In hindsight, perhaps we should have included at least a few footnotes to highlight some of the major differences between office- and manufacturing-based mapping conventions. The treatment of lead time is one of those differences.
Lead Time: Office vs. Manufacturing
In any value stream there are multiple measures of lead time (also known as throughput time, turnaround time, and response time), including:
the lead time to fulfill a customer request (the “customer experience”)
the material lead time from request to delivery (the “material experience”)
the lead time for each process block in the value stream
The customer experience lead time is the elapsed time from receiving a customer request to delivering on that request. The lead time for extended value streams can also include the lead time for processes before a customer request is received (supply chain, sales and marketing processes, etc.) and after delivery (warranty work, invoicing, etc.).
In manufacturing, the lead time between process blocks is calculated based on the days of demand of the observed WIP that has accumulated between process blocks: Lead Time = Observed WIP/Daily Customer Demand. This may or may not represent how long it takes the following process to consume the materials.
In office, service, and knowledge work environments, we define the lead time for each process in the value stream as the elapsed time from the moment work is made available to a person, work team, or department until it has been completed and made available to the next person, work team, or department in the value stream.
We use this approach for a number of reasons:
Office, service, and knowledge work environments often have high degrees of variation in workloads and accumulated WIP.
These environments are often staffed with “shared resources” who support many value streams and juggle many priorities, and therefore, are not always available to perform work when it arrives.
We believe it’s the most sensible way to reflect workflow in low volume environments—e.g., month-end close only occurs 12 times a year, its duration is just several days, and there’s only one month-end close being done at a time.
In office, service and knowledge work environments, we recommend that you follow a single “work item” as it passes through the value stream, whether it’s verbal information, electronic information, or a physical item (which may include people as in healthcare patients, restaurant customers, etc.).
(Keep in mind that work items in office and service settings typically transform as they pass through a value stream, just like a product does in manufacturing. For example, the work items in a software development value stream mapping activity I recently facilitated are: email request → request for quote → quotation → purchase order → work order → beta code → final code → invoice. Every value stream has its own version of work item transformation.)
To repeat, the process block lead time for a single work item is the elapsed time from the moment it’s received until it’s handed off to the next process in the value stream. It includes the process time (the time it takes to actually do the work, also referred to as touch time and cycle time), as well as any waiting/delays that may occur:
before anyone begins working on it
during the work (e.g., waiting for clarification)
after the work is complete, but hasn’t yet been passed on the next process (as can be the case in batching, interruptions, and shifting priorities)
Example: LT = 2 hours for a work item that arrives in Work Area A at 1 pm and is passed to Work Area B at 3 pm is two hours. If the work takes 20 minutes to complete, the lead time is still two hours, but 20 minutes of the two-hour lead time is process time and the work sits idle for 1 hour and 40 minutes.
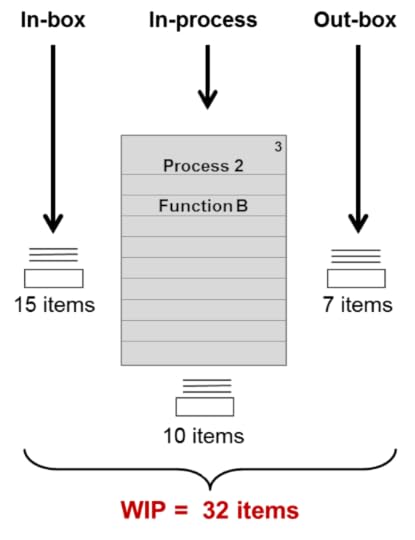
Note, too, that WIP can accumulate during any of the three stages bulleted above. We typically include WIP on our value stream maps to see where the largest queuing and constraints lie versus using those numbers to calculate the lead time. (However, in high volume office “production” areas with dedicated resources, the lead time will approximate WIP/daily demand).
As you can see on the sample value stream maps in our book’s Appendices and on the VSM segment shown later in the post, the WIP for a particular process is shown to the left of the process block and includes WIP from any of the three stages listed above:
Timeline Treatment
Sadly, there is no industry-wide standard for value stream metrics and timeline conventions. Some people break process time into value-adding and non-value-adding time and show the sum for each category. Some people separate pure waiting time from the lead time rather than viewing it as total throughput time. Some people use the traditional square-wave timeline shape (commonly referred to as “sawtooth” shape), while others use a straight line. And so on.
Until three years ago, I used the square-wave type timeline and placed the lead time on the “peak” of the timeline to the left of the process block it referred to. And I placed process time in the “trough” of the timeline directly below the process block it referred to.
But over the years, I found that teams consistently got tripped up with which metric went where. And the metrics placement didn’t make intuitive sense to many teams when they had to reverse the placement in their minds in order to calculate Activity Ratio. Activity Ratio (AR) is a summary metric we use to reflect the degree of flow, which we’ve described in Value Stream Mapping (p. 90), as well as our two earlier books, The Kaizen Event Planner and Metrics-Based Process Mapping: AR = (Sum of timeline process times/Sum of timeline lead times) x 100. In the formula, process time is on top. On a sawtooth timeline, it’s on the bottom.
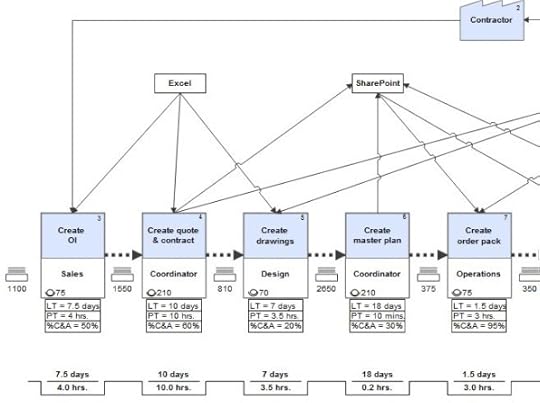
For these reasons, I eventually moved to a single line timeline, with process time on the top and lead time on the bottom. In the below example, process time is above the line and expressed in minutes, and the lead time is below the line and expressed in hours:
Unfortunately, our preferred software for creating electronic versions of maps (which aid in distribution and storage), iGrafx® FlowCharter, doesn’t yet have a straight line option for the timeline. But we found a workaround that enables us to place both metrics directly below the process block, which approximates a manually drawn straight line. However, due to iGrafx hard-coded conventions, the lead time remains on top. I share this because it answers the question we’ve gotten about why the timelines on the sample value stream maps we included in the Value Stream Mapping appendices look as they do:
So that’s the story. I hope this clarifies why and how we treat lead time the way that we do. I invite your comments and will continue to periodically post responses to the questions we’re getting, so please keep them coming.
As a reminder, I offer free monthly webinars where I cover topics such as this. You can learn about them by subscribing: www.ksmartin.com/subscribe.
You can also listen to the recordings for past webinars on our website, YouTube, Vimeo, and SlideShare (which also includes the slides). I’ve given six webinars on value stream mapping in the past six months, which you may find helpful.
Click here to register for my next value stream mapping webinar, hosted by Gemba Academy on Wednesday April 23 at 9 am Pacific Time.
And for more information on the book, visit www.ksmartin.com/value-stream-mapping. We give in-house value stream mapping workshops as well.
I wish you the best as you begin experimenting with or refine your use of value stream mapping to transform your value streams.
April 2, 2014
The Power of Hope in Improvement

I love how conversations can challenge one’s thinking and spark new ideas. Interviews—for a new job, a board position, or with the media—are particularly rich opportunities to stretch your mental muscles and discover what you really believe. And sometimes you can be very surprised by where the conversation takes you.
One such surprise occurred for me during a recent podcast with LeanBlog’s Mark Graban about my latest book, Value Stream Mapping (with co-author Mike Osterling). Around 26 minutes into the podcast, the conversation turned to how powerful value stream maps are in illuminating the truth about current work systems and how invigorating it is when people see that they can actually fix the problems that have been creating organizational drag.
This led me to share a revelation I had had a day earlier about the vital role that hope plays in the improvement process: “Part of what the transition phase between the current state and future state is about is giving people hope. We don’t talk about hope in business circles. But when people are beaten down and frustrated with the amount of chaos that they deal with day in and day out, hope is a great antidote to resistance [to change]. And hope is the way forward.”
Now lest you think that topic’s excessively “squishy,” I went on to say: “Of course, it [hope] has to be followed by execution, but I think hope is a good place to start.” Mark added: “When people start to see the possibility, it’s great to see how people start to turn from despair to optimism.”
Indeed. I’ve long believed that improvement results are largely dependent on establishing success-oriented mindsets and preconditions, but considering the role of hope and optimism in solving problems and transformation organizations creates rich new territory for us to explore.
It’s been two months since we recorded the podcast and, in that time, I’ve visited six different clients. I’ve been paying particular attention to mindsets and looking for patterns around degrees of hope. I’ve also experimented with using hope to stimulate more innovative thinking. It seems to be working. Improvement teams at the last three clients have designed future state that have far exceeded any of the teams I’ve led in the past 20 years of being in business.
In the most dramatic case, a team has designed a future state that’s projected to deliver the following results:
Lead time reduction from 17 months to 7.5 months (56% improvement)
Freed capacity equivalent to 22 FTEs (full-time equivalents). Note: No layoffs will occur.
$25 million in freed working capital (annualized)
Time will tell how close this client comes to their projections (see Chapter 4 in Value Stream Mapping for information on calculating projected results), but I’m placing money on them. Their ability to achieve this dramatic level of improvement exists, in large part, because they had high levels of hope going into the transformation cycle they’re now in.
They also possessed high levels of three additional psychological levers that I’ve found are preconditions to making significant improvement:
Will — To succeed in improvement, you have to WANT to improve. All too often I see organizations whose actions don’t match their words. If you want to lose weight, but you’re not willing to become more active or alter your food intake, you’re not going to see any results. And merely checking a box (yay, I thought about weight loss!) isn’t going to move the scale’s needle at all. You either want it or you don’t. It’s disrespectful to all parties involved to approach improvement with no demonstrable will.
Belief — You have to BELIEVE that improvement is possible. While facilitating teams, I often sense their waning belief that they can create the future condition that they desire. But as Theodore Roosevelt said, “Believe you can and you’re halfway there.” (Hat tip to @dirkhinze for Tweeting this quote over the weekend.) Obviously the organization needs to commit to improvement upfront (including the proper resources to make improvement) or a team’s lack of belief will be well-earned. But a skilled facilitator can build belief in a team who will otherwise fall prey to disbelief.
Courage — Making change of any sort is difficult. The more complex the improvement and the more people it touches, the more difficult it is. It takes a healthy dose of COURAGE and intestinal fortitude to successfully transform a culture and its work systems. You need courageous leadership and courageous team members. You have to be willing to let leaders with outdated paradigms and management styles go. You have to be willing to have your Board, Congress, or Wall Street breathing down your neck when you opt for a measured approach to improvement. You have to be willing to go against the grain.
But underlying all of these is HOPE. Hope for a better tomorrow. Hope for less stress and frustration. Hope for shorter work days and more time with family. Hope for processes that don’t require heroics to succeed. Hope for customers who want to come back again and again and sing your praises to prospective customers.
It’s our job as leaders, improvement professionals, business management consultants, and academics to take a hard look at hope and do all we can to deliver on it. When you feel the visceral shift in a team as hope emerges, see physical changes that reflect that shift, and hear the verbal evidence that hope has indeed arrived, THAT’S when the magic happens.
It certainly takes a lot more than hope to get results. But hope is a damn good place to start.
To listen to the podcast referenced: www.leanblog.org/190.
Photo by Tracey Clark. Reprinted with permission.